


AAVE TOKEN PRICE ANALYSIS: AAVE token price is at an interesting level, as it forms a chart pattern, what’s next?

- The AAVE token price is trading in a small range on a daily time frame.
- The token price is forming a symmetrical triangle pattern on a daily time frame.
- The pair of AAVE/BTC is trading at the price level of 0.004283 with an increase of 0.79% in the past 24 hours.
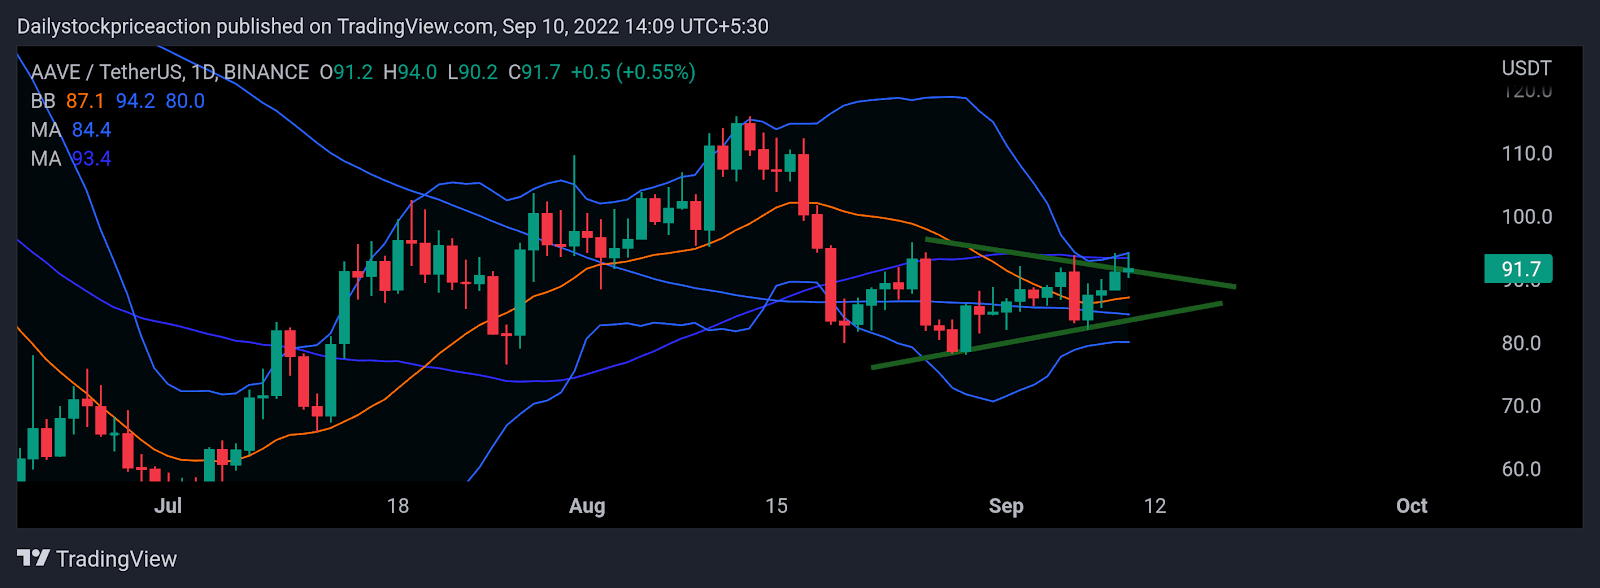
Source: AAVE/USDT by tradingview
The AAVE token price is trading at the supply zone, as per the price action on a daily time frame. The token price is consolidating in a small range as it makes higher highs and lower lows from the demand zone and supply zone respectively. As a result, the token price is currently indecisive and a breakout on either side will trigger a massive move. The AAVE token price is trading at the long-term demand zone on a weekly time frame. The recent fall in the price of the AAVE token price has resulted in the token price falling. At present, the token price has bounced off from the demand zone, as it formed an inside bar bullish candlestick pattern. At present, the token price is trading below the 50 and 100 MAs. The recent fall in the token price led to the breakdown of the important MAs. Moving upwards the token price can be seen facing strong bearish pressure from these MAs. The AAVE token price is currently trading at the upper band of the Bollinger band indicator. Currently, the range of the Bollinger Band indicator has narrowed indicating a massive move in the upcoming trading days.
The AAVE token price is forming a symmetrical triangle pattern on a daily time frame
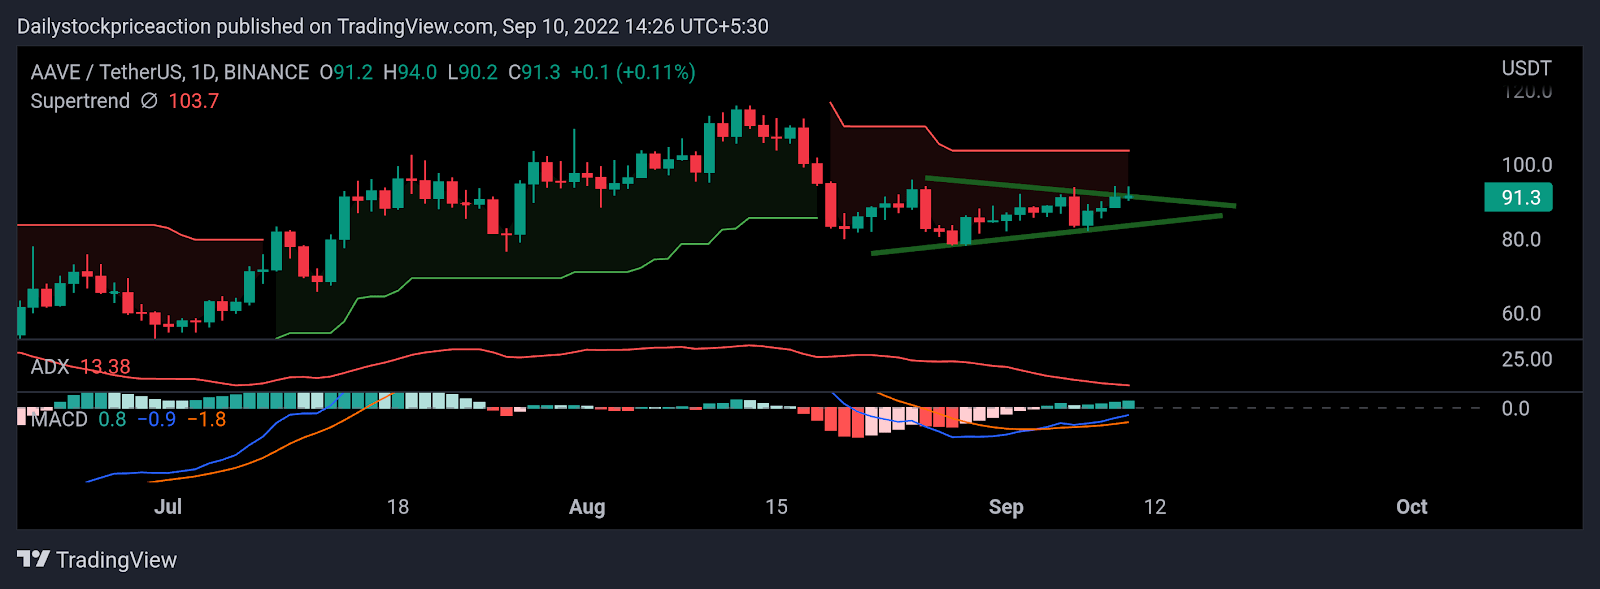
Source: AAVE/USDT by tradingview
Moving Average Convergence Divergence: MACD indicator has given a positive crossover as the token gave a breakout of the supply zone. The blue line crossed the orange line on the upside. This has resulted in the token price moving up strongly. Recently the AAVE token price fell after the breakout of small resistance, as a result, the MACD indicator also depicted the same. Once the token price starts moving up again after breaking the symmetrical triangle, the gap between the blue and orange lines can be seen widening supporting the trend.
Average Directional Movement Index: ADX curve is moving downwards since the token price fell to the demand zone. Since then the ADX curve has not turned upwards. Currently, the ADX curve has slipped below the 20 mark. As of now, the ADX curve has turned sideways indicating a possible halt in the price movement and change in price structure after the breakout.
Supertrend: The AAVE token price rose above the demand zone with a strong bullish candlestick pattern. The token brokedown of the super trend buy line triggered the sell signal. As of now, the AAVE token is trading below the super trend sell signal line. Going forward this line could act as a strong supply zone. For the token price to turn bullish it needs to break the super trend sell line with a strong bullish candlestick pattern.
CONCLUSION: The AAVE token price is trading in a small symmetrical triangle. The token price is bullish as the technical parameters suggest. Despite the fall in the overall cryptocurrency market the AAVE token price has managed to stay above the demand zone. An investor should remain cautious and wait for a clear trend before taking any action.
SUPPORT: $80 and $85
RESISTANCE: $100 and $110
Disclaimer
The views and opinions stated by the author, or any people named in this article, are for informational ideas only, and they do not establish financial, investment, or other advice. Investing in or trading crypto assets comes with a risk of financial loss.


 Bitcoin
  Ethereum
  Tether
  USDC
USDC  Dogecoin
  Cardano
  Bitcoin Cash
  Polygon
  Litecoin
  LEO Token
  Hedera
  Stellar
  Cosmos Hub
  OKB
OKB  Maker
Maker  Algorand
  NEO
NEO  Gate
Gate  KuCoin
  Synthetix Network
  IOTA
IOTA  Tether Gold
  TrueUSD
  Enjin Coin
  Holo
Holo  Ravencoin
  0x Protocol
  Siacoin
  Basic Attention
  Ontology
  Decred
  Zcash
Zcash  Waves
Waves  Lisk
Lisk  DigiByte
  Numeraire
  Status
  Nano
Nano  Pax Dollar
  Steem
Steem  OMG Network
  BUSD
BUSD  Ren
Ren  Bytom
Bytom  Bitcoin Diamond
  HUSD
HUSD  Energi
  Augur
Augur