


After a 12% Weekly Drop, BTC Needs to Protect This Level to Prevent Another Crash (Bitcoin Price Analysis)

The past few days have been quite challenging for the entire cryptocurrency, market, and Bitcoin is no exception, standing above $18K. The next few days can be deciding for the mid-term future of the entire market as a break below this level could extend the bear market considerably.
Technical Analysis
By: Edris
The Daily Chart
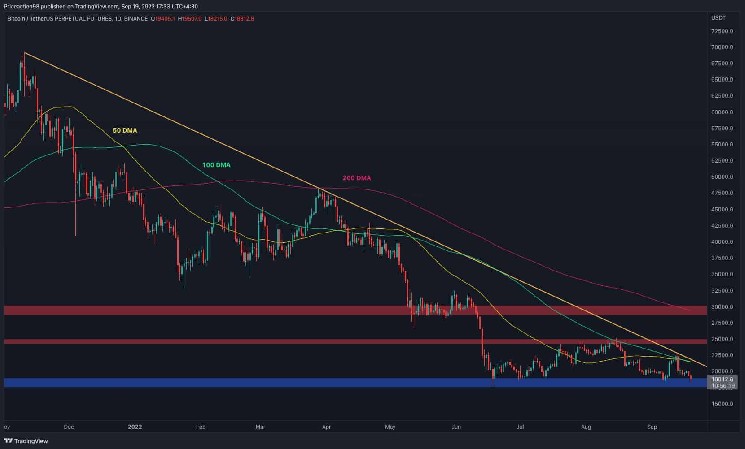
On the Daily chart, the price failed to break the significant bearish trendline last week. The 50-day and 100-day moving average lines located near the $22K level also played their part in pushing the price to the downside.
Currently, the market is testing the $18K support area for the third time. However, considering the overwhelming bearish momentum, a break below this significant level is likely.
In this case, Bitcoin would record a new lower low in the current bear market, and the price could drop towards the $15K area and potentially further downward in the short-term. The crash would also further prolong the duration of the bear market and bring it close to a full year.
The 4-Hour Chart
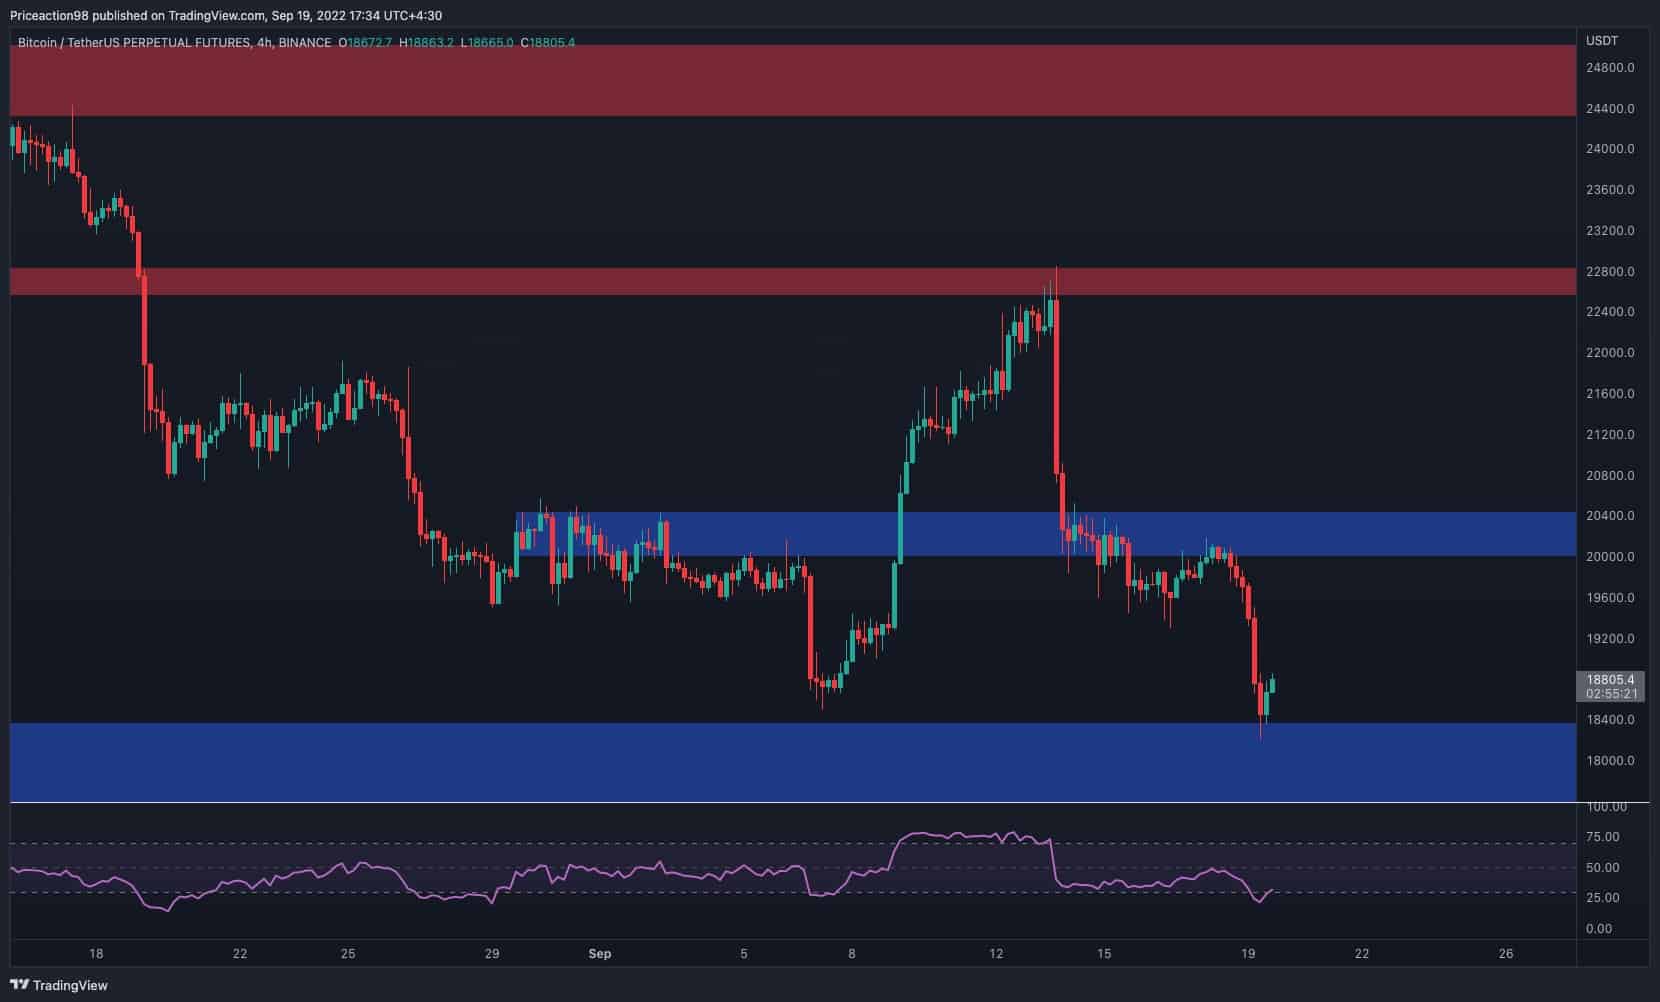
Looking at the 4-hour timeframe, the price has rapidly dropped from the $22,500 resistance and has descended below the $20K support level. After a few days of consolidation, the price dropped once more towards the $18K support, after failing to break above that vital $20K mark.
The bulls are currently making their last stand at $18K, as a breakdown of this level would cause another round of capitulation and a deeper crash.
However, it’s important to note that turning the market to the upside may not be an easy task, as both the price action and the RSI indicator demonstrate a clear bearish momentum.
Onchain Analysis
By Shayan
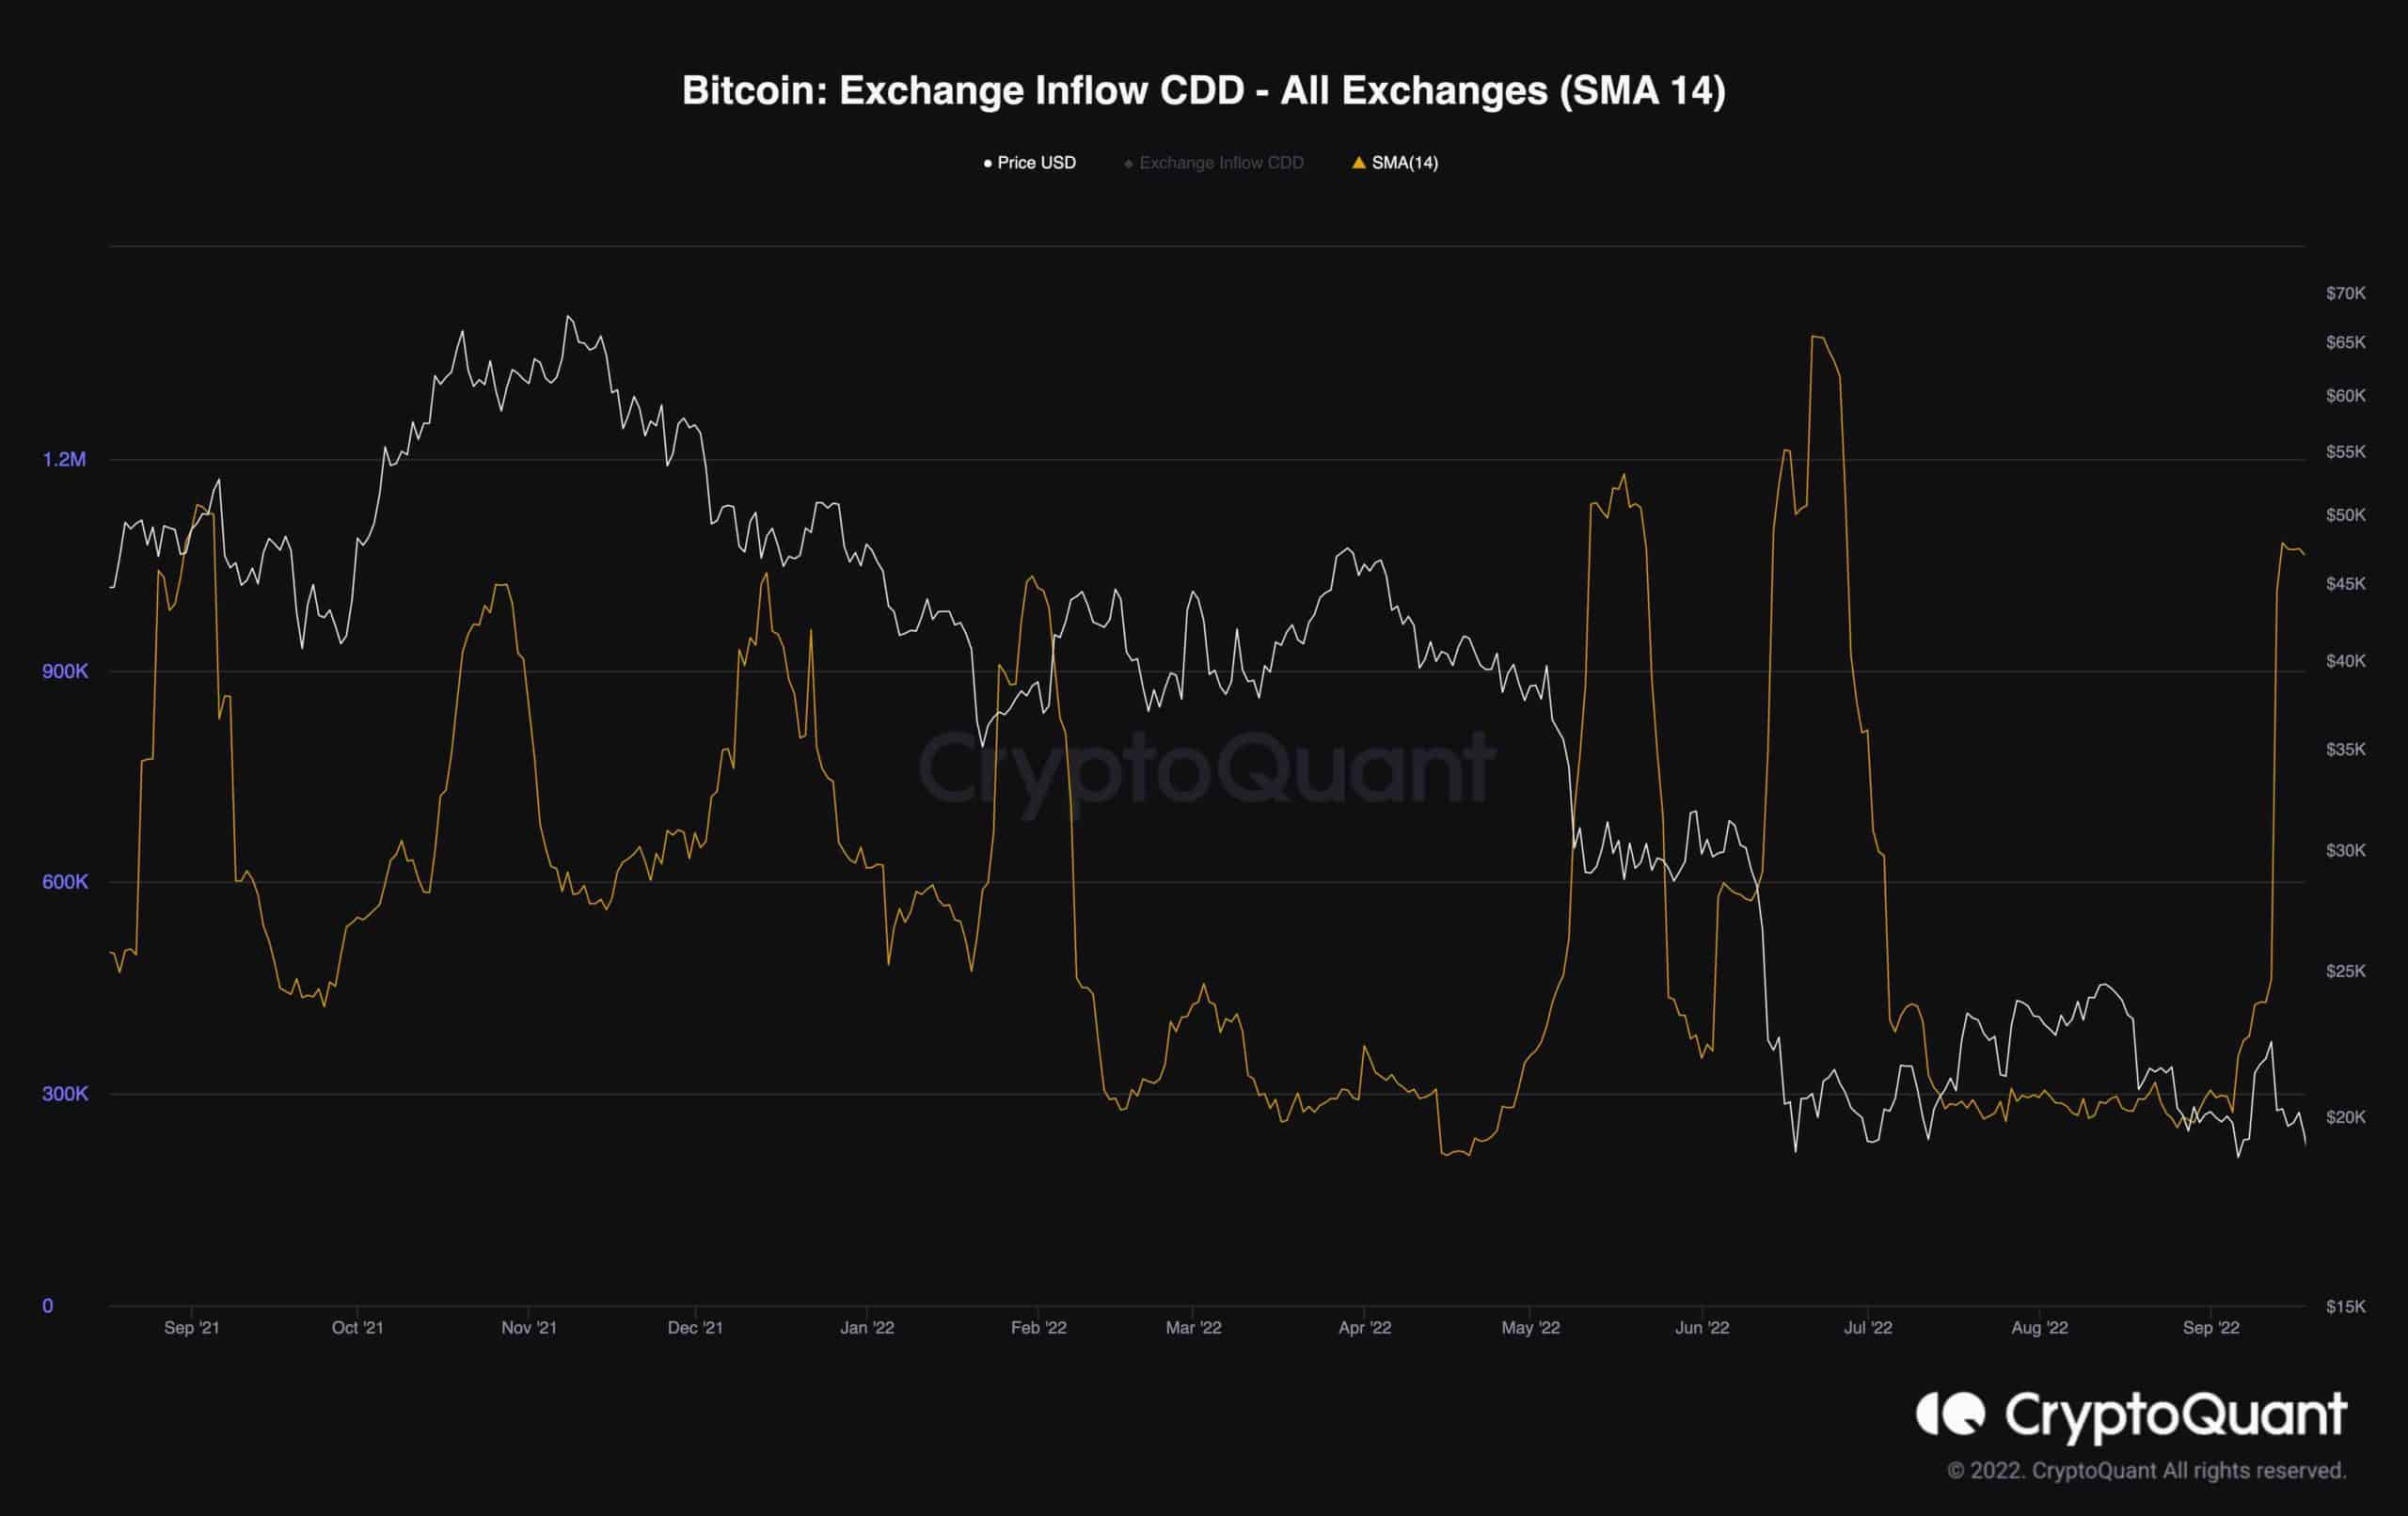
Long-term holders are a crucial cohort among market players, and following their behavior might help determine the market’s direction. Historically, whenever long-term holders sent a considerable amount of Bitcoin to the exchanges, the market experienced a plunge.
The Exchange Inflow CDD is a valuable metric to track their behavior. High values indicate that more long-term holders moved their coins for potential selling.
The metric(14-day moving average) has recently spiked, indicating possible selling pressure coming from the long-term holders. Hence, a downward rally to the $16K level might be the most probable scenario for Bitcoin in the short-term view.


 Bitcoin
  Ethereum
  Tether
  USDC
USDC  Dogecoin
  Cardano
  Bitcoin Cash
  Polygon
  Litecoin
  LEO Token
  Hedera
  Stellar
  Cosmos Hub
  OKB
OKB  Maker
Maker  Algorand
  NEO
NEO  Gate
Gate  KuCoin
  Synthetix Network
  IOTA
IOTA  Tether Gold
  TrueUSD
  Enjin Coin
  Holo
Holo  Ravencoin
  Siacoin
  0x Protocol
  Basic Attention
  Ontology
  Decred
  Zcash
Zcash  Lisk
Lisk  Waves
Waves  DigiByte
  Numeraire
  Status
  Nano
Nano  Pax Dollar
  Steem
Steem  OMG Network
  BUSD
BUSD  Ren
Ren  Bytom
Bytom  Bitcoin Diamond
  HUSD
HUSD  Energi
  Augur
Augur