


AMP Price Analysis: When will AMP Crypto Escape this Falling Pattern?

- AMP price has been declining through a falling wedge pattern over the daily price chart.
- AMP crypto slipped below the 20, 50, 100, and 200-day Daily Moving Average.
- The pair of AMP/BTC is at 0.000000271 BTC with an intraday gain of 6.01%.
The price of AMP is falling inside a descending triangle pattern over the daily chart. The AMP bulls are pushing the token higher. However, bears are seeking to pull the breakdown token. AMP investors need to keep an eye on the daily chart for any changes in trends. The lengthy bear market conditions are to blame for the long decline of AMP currency. In an effort to break out of the consolidation phase, Bitcoin is currently dropping below the psychological threshold of $25000 as it battles to retain its upward momentum. As they also struggled to draw in buyers, the other altcoins began soaring bearishly over the chart.
AMP’s CMP price is $0.00508 right now, up 3.55% from the previous day’s market value. However, trade volume jumped by 74.82% during the intraday trading session. This shows that bulls are making an effort to stop AMP from plummeting. The volume to market cap ratio is 0.07544.
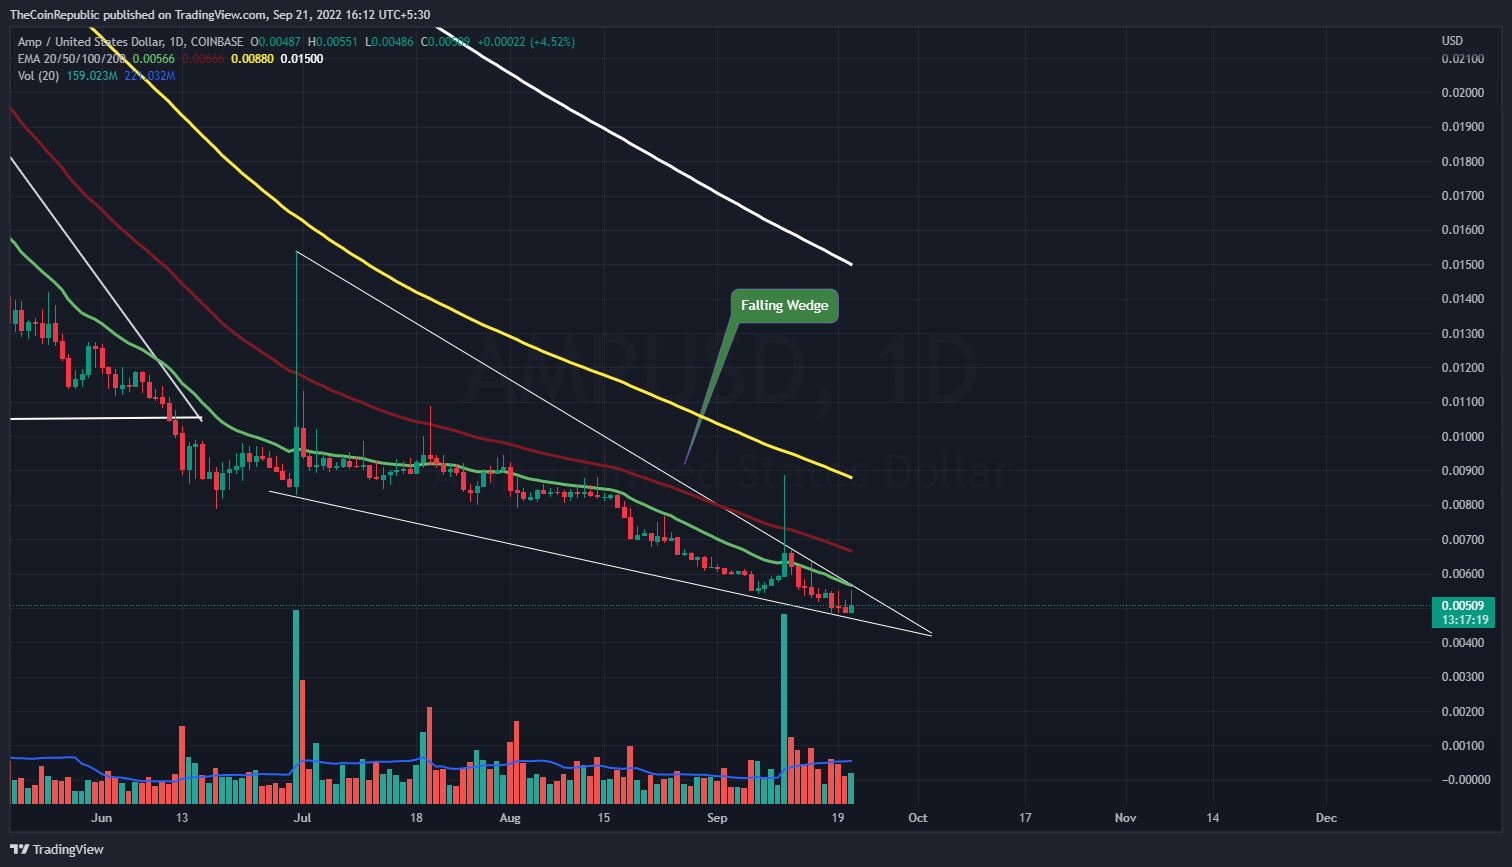
Source: AMP/USD by TradingView
The AMP coin price is striving to develop a significant upward momentum on the daily chart. The token has been descending through a sequence of triangles. The declining pattern of AMP is being maintained, as indicated by red volume bars. The token needs to win over current users and attract new ones in order to buck the trend. However, bears are currently in charge and trying to capture the token’s destruction.
Bulls must advance to stop future market corrections since the price of AMP coin is currently in a critical make-or-break situation.
What do Technical Indicators suggest about AMP?
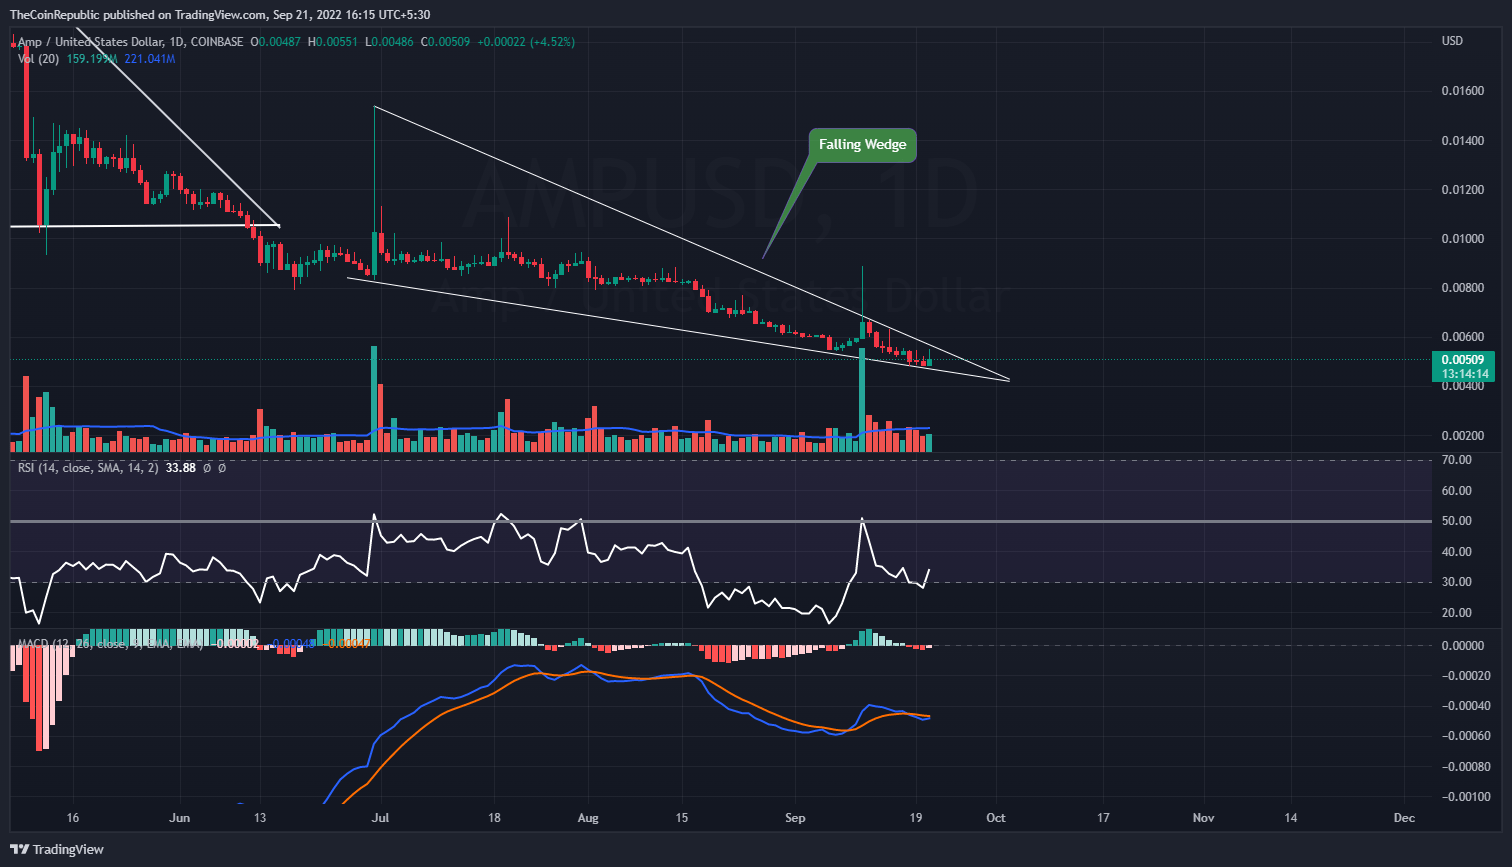
Source: AMP/USD by TradingView
The price of AMP is seeking to break through the falling wedge formation. Currently, the token is trading in a circumstance that might make or break it. To avoid slipping into the bearish trap, AMP needs to break out of the pattern. Technical indicators demonstrate the AMP cryptocurrency’s upward trajectory.
The Relative Strength Index indicates that AMP is making an effort to leave neutrality. The RSI, which is at 33 and trying to rebound, can be seen below a downward trendline because it hasn’t been indicated for such a long time. As soon as the AMP coin leaves the oversold area, investors might expect any direction movement. The AMP coin’s consolidation phase is visible on the MACD. The signal line is above the MACD line.
Conclusion
The price of AMP is falling inside a descending triangle pattern over the daily chart. The AMP bulls are pushing the token higher. However, bears are seeking to pull the breakdown token. AMP investors need to keep an eye on the daily chart for any changes in trends. The lengthy bear market conditions are to blame for the long decline of AMP currency. In an effort to break out of the consolidation phase, Bitcoin is currently dropping below the psychological threshold of $25000 as it battles to retain its upward momentum. However, bears are currently in charge and trying to capture the token’s destruction. Technical indicators demonstrate the AMP cryptocurrency’s upward trajectory. The AMP coin’s consolidation phase is visible on the MACD. The signal line is above the MACD line.
Technical Levels
Support Level: $0.0048
Resistance Level: $0.0055
Disclaimer
The views and opinions stated by the author, or any people named in this article, are for informational ideas only, and they do not establish any financial, investment, or other advice. Investing in or trading crypto assets comes with a risk of financial loss.


 Bitcoin
  Ethereum
  Tether
  USDC
USDC  Dogecoin
  Cardano
  Bitcoin Cash
  Polygon
  Litecoin
  LEO Token
  OKB
OKB  Stellar
  Cosmos Hub
  Hedera
  Maker
Maker  Algorand
  NEO
NEO  Synthetix Network
  Gate
Gate  KuCoin
  IOTA
IOTA  Tether Gold
  TrueUSD
  Enjin Coin
  0x Protocol
  Ravencoin
  Holo
Holo  Siacoin
  Basic Attention
  Ontology
  Zcash
Zcash  Decred
  Lisk
Lisk  Waves
Waves  DigiByte
  Numeraire
  Status
  Nano
Nano  Pax Dollar
  Steem
Steem  OMG Network
  BUSD
BUSD  Ren
Ren  Bitcoin Diamond
  Bytom
Bytom  HUSD
HUSD  Energi
  Augur
Augur