


Avalanche price analysis: AVAX/USD gains value at $23.01

Avalanche price analysis reveals that the cryptocurrency is currently on a strong bullish run after a period of consolidation. The AVAX/USD pair has surged by over 9.52 percent in the past 24 hours and is trading at $23.01 at press time. The bulls have been in control of the market since the beginning of the month and have pushed the price up from $18.50 to its current level. The resistance levels to watch out for are $23.56 and the support levels are at $20.98.The market cap for the cryptocurrency is currently at $6.63 billion and the 24-hour trading volume is $954 million.
AVAX/USD 1-day price chart: Bullish momentum builds
The 1-day Avalanche price analysis shows that the market has been trading in a range-bound manner since the beginning of the month. The bulls managed to push the price up from the $18 level to the $23 level but failed to sustain the momentum. The bears could not take advantage of the situation and the bulls took control of the market again.
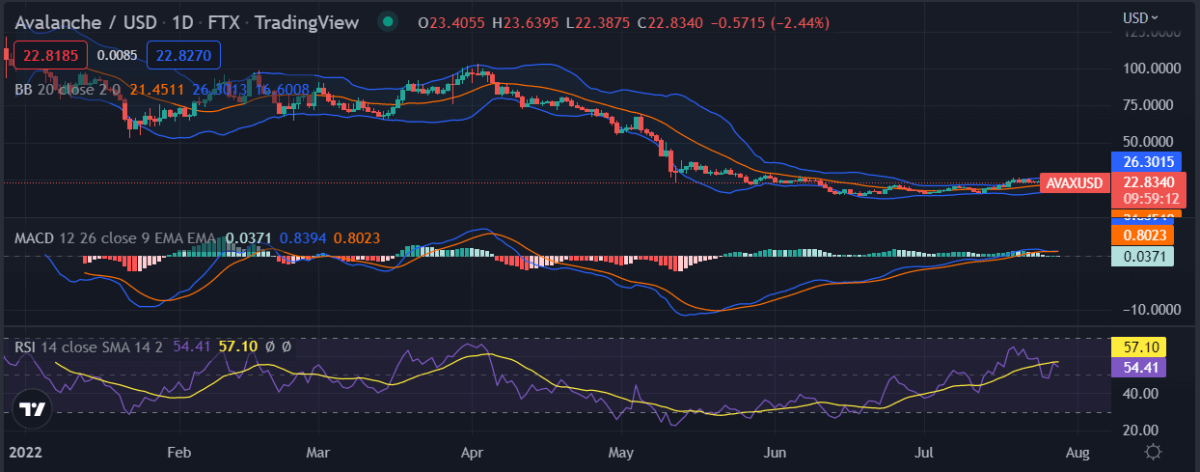
AVAX/USD 1-day price chart, source: Tradingview
The bulls are currently in control of the market and are looking to push the price higher as the MACD indicator is currently in the bullish zone and is signaling a buying opportunity. The Relative Strength Index is also in the overbought region, which indicates that the buyers are in control of the market. The Upper Bollinger Band is currently at $24.04 and the Lower Bollinger Band is at $21.68.
Avalanche price analysis on a 4-hour chart: AVAX/USD gains tremendous value
The four-hour Avalanche price analysis indicates that the market is on a strong bullish run as the price has surged above the $23 level. The coin has been forming higher highs and higher lows, which indicates that the bulls are in control of the market. The market has been trading at $23.01 for the last 4 hours.
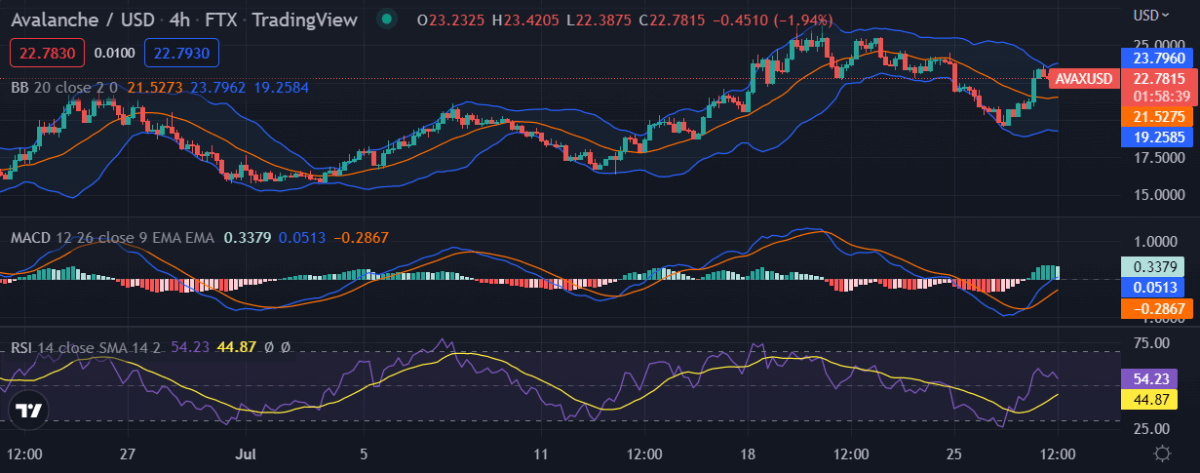
AVAX/USD 4-hour price chart, Source: Tradingview
The MACD line blue is currently above the signal line, which indicates that the bulls are in control of the market. The Relative Strength Index is currently at 68.71 and is signaling a buying opportunity. The Upper Bollinger Band and the Lower Bollinger Band both show a strong bullish momentum as they are currently at $24.35 and $21.91 respectively.
Avalanche price analysis conclusion
Overall, Avalanche price analysis shows that the market is in a strong uptrend and is likely to continue moving higher. Resistance levels to watch out for are $23.56 and a break of this level could lead the price to $25. Support levels are at $20.98 and a break below this level could lead the price to $18.50 and may even extend to $17.50 in the near term. The technical indicators are all signaling a buying opportunity and the market is expected to continue its bullish in the near term.
Disclaimer. The information provided is not trading advice. Cryptopolitan.com holds no liability for any investments made based on the information provided on this page. We strongly recommend independent research and/or consultation with a qualified professional before making any investment decisions.


 Bitcoin
  Ethereum
  Tether
  USDC
USDC  Dogecoin
  Cardano
  Bitcoin Cash
  Polygon
  Litecoin
  LEO Token
  OKB
OKB  Cosmos Hub
  Stellar
  Hedera
  Maker
Maker  Algorand
  NEO
NEO  Synthetix Network
  Gate
Gate  KuCoin
  IOTA
IOTA  Tether Gold
  TrueUSD
  Enjin Coin
  0x Protocol
  Ravencoin
  Holo
Holo  Siacoin
  Basic Attention
  Decred
  Zcash
Zcash  Ontology
  Waves
Waves  Lisk
Lisk  DigiByte
  Numeraire
  Status
  Nano
Nano  Pax Dollar
  Steem
Steem  OMG Network
  BUSD
BUSD  Ren
Ren  Bitcoin Diamond
  Bytom
Bytom  HUSD
HUSD  Energi
  Augur
Augur