


BarnBridge (BOND) Price Prediction 2022 — Will BOND Hit $60 Soon?
- Bullish BOND price prediction for 2022 is $22.165 to $38.322.
- The BOND price will also reach $60 soon.
- Bearish BOND price prediction for 2022 is $4.051.
In BarnBridge (BOND) price prediction 2022, we use statistics, price patterns, RSI, RVOL, and other information about BOND to analyze the future movement of the cryptocurrency.
BarnBridge (BOND) Current Market Status
According to CoinGecko, the price of BarnBridge (BOND) is $19.35 with a 24-hour trading volume of $167,032,481 at the time of writing. However, BOND has decreased to 1.9% in the last 24 hours.
Moreover, BarnBridge (BOND) has a circulating supply of 7,124,031 BOND. Currently, BOND trades in cryptocurrency exchanges such as Binance, Uniswap (v2), ZB.COM, Coinbase, Gate.io, KuCoin, and LATOKEN.
What is BarnBridge (BOND)?
BarnBridge (BOND) is the governance token of the BarnBridge Protocol, a DeFi risk tokenizing protocol. BOND was launched as an ERC-20 token along with the BarnBridge protocol in September 2020. BOND is primarily deployed in the governance functionalities within the BarnBridge DAO and it grants voting rights to its users. It is also used in staking and is also given out to users as incentives.
Structured Market Adjusted Risk Tranches (SMART) bonds applications were launched within the BarnBridge protocol to mitigate risks linked to the fluctuations in market price and yield. Firstly, SMART Yield is deployed in the mitigation of interest rate volatility across several DeFi platforms such as Compound, Curve, and AAVE. Secondly, SMART Alpha mitigates the risk of price fluctuations. Thirdly, SMART Exposure manages the risk involved in trading ERC-20 token pairs.
BarnBridge (BOND) Price Prediction 2022
BarnBridge (BOND) holds the 195th position on CoinGecko right now. BOND price prediction 2022 is explained below with a daily time frame.
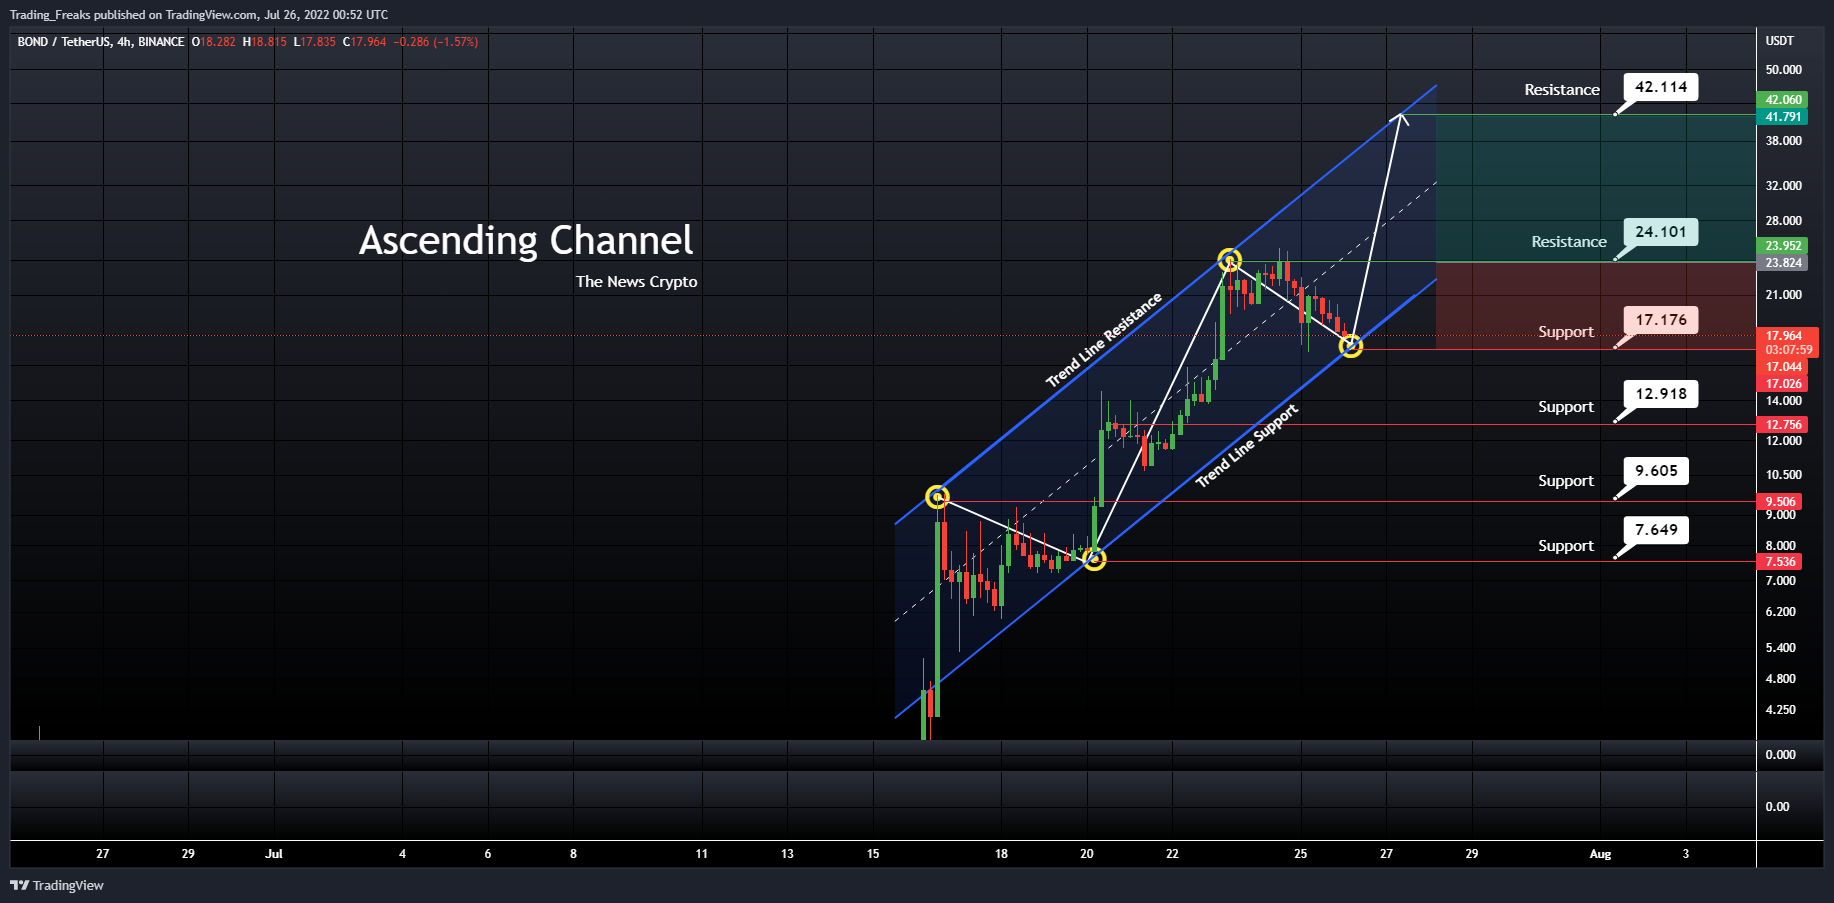
BOND/USDT Ascending Channel Pattern (Source: Tradingview)
The above chart of BarnBridge (BOND) laid out an ascending channel pattern, also known as the rising channel. The upper and lower trendlines that connect the higher highs and higher lows respectively appear to move within a rising slope. This pattern is generally a characteristic of a bullish trend.
Currently, BarnBridge (BOND) is at $17.964. If the pattern continues, the price of BOND might reach the resistance level of $24.101, and $42.114. If the trend reverses, then the price of BOND may fall to $17.176, $12.918, $9.605, and $7.649.
BarnBridge (BOND) Support and Resistance Levels
The chart below shows the support and resistance levels of BarnBridge (BOND).
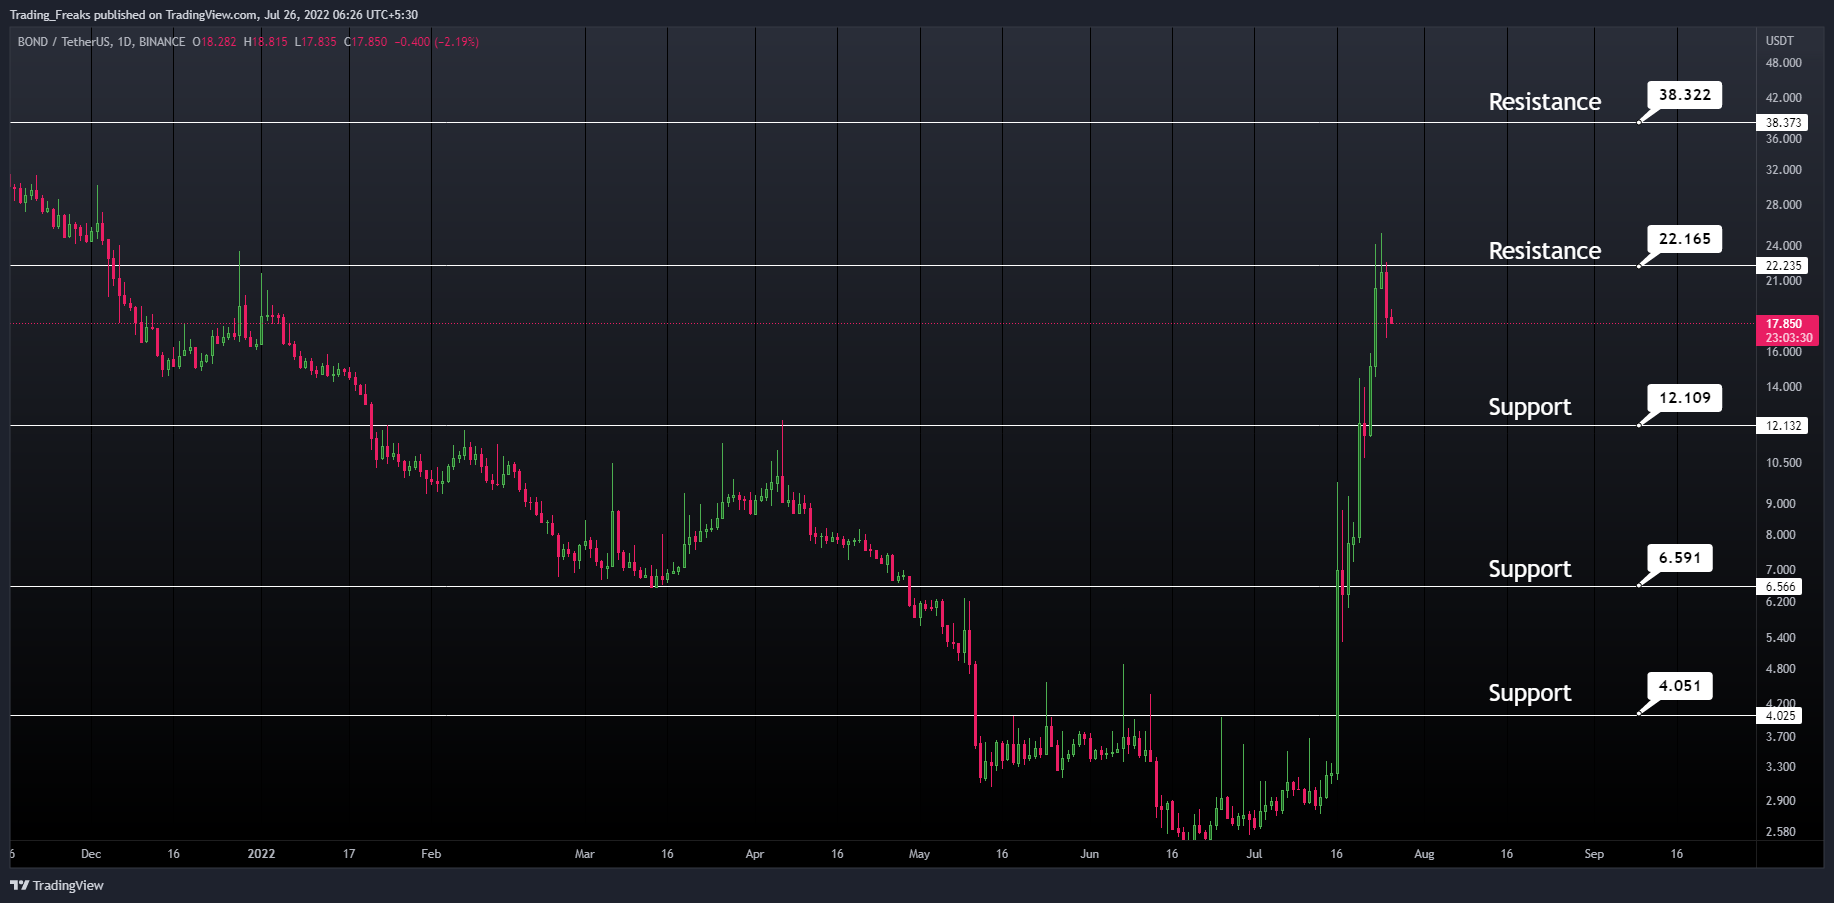
BOND/USDT Support and Resistance Level (Source: Tradingview)
From the above daily time frame, we can clearly interpret the following as the resistance and support levels of BarnBridge (BOND).
| Resistance Level 1 | $22.165 |
| Resistance Level 2 | $38.322 |
| Support Level 1 | $12.109 |
| Support Level 2 | $6.591 |
| Support Level 3 | $4.051 |
BOND Support and Resistance Levels
The charts show that BOND has performed a bullish trend over the past month. If this trend continues, BOND might run along with the bulls overtaking its resistance level at $38.322.
Accordingly, if the investors turn against the crypto, the price of the BOND might plummet to almost $4.051, a bearish signal.
BarnBridge (BOND) Price Prediction 2022 — RVOL, MA, and RSI
The Relative Volume (RVOL) of BarnBridge (BOND) is shown in the below chart. It is an indicator of how the current trading volume has changed over a period of time from the previous volume for traders. Currently, the RVOL of BOND lies below the cutoff line, indicating weak participants in the current trend.
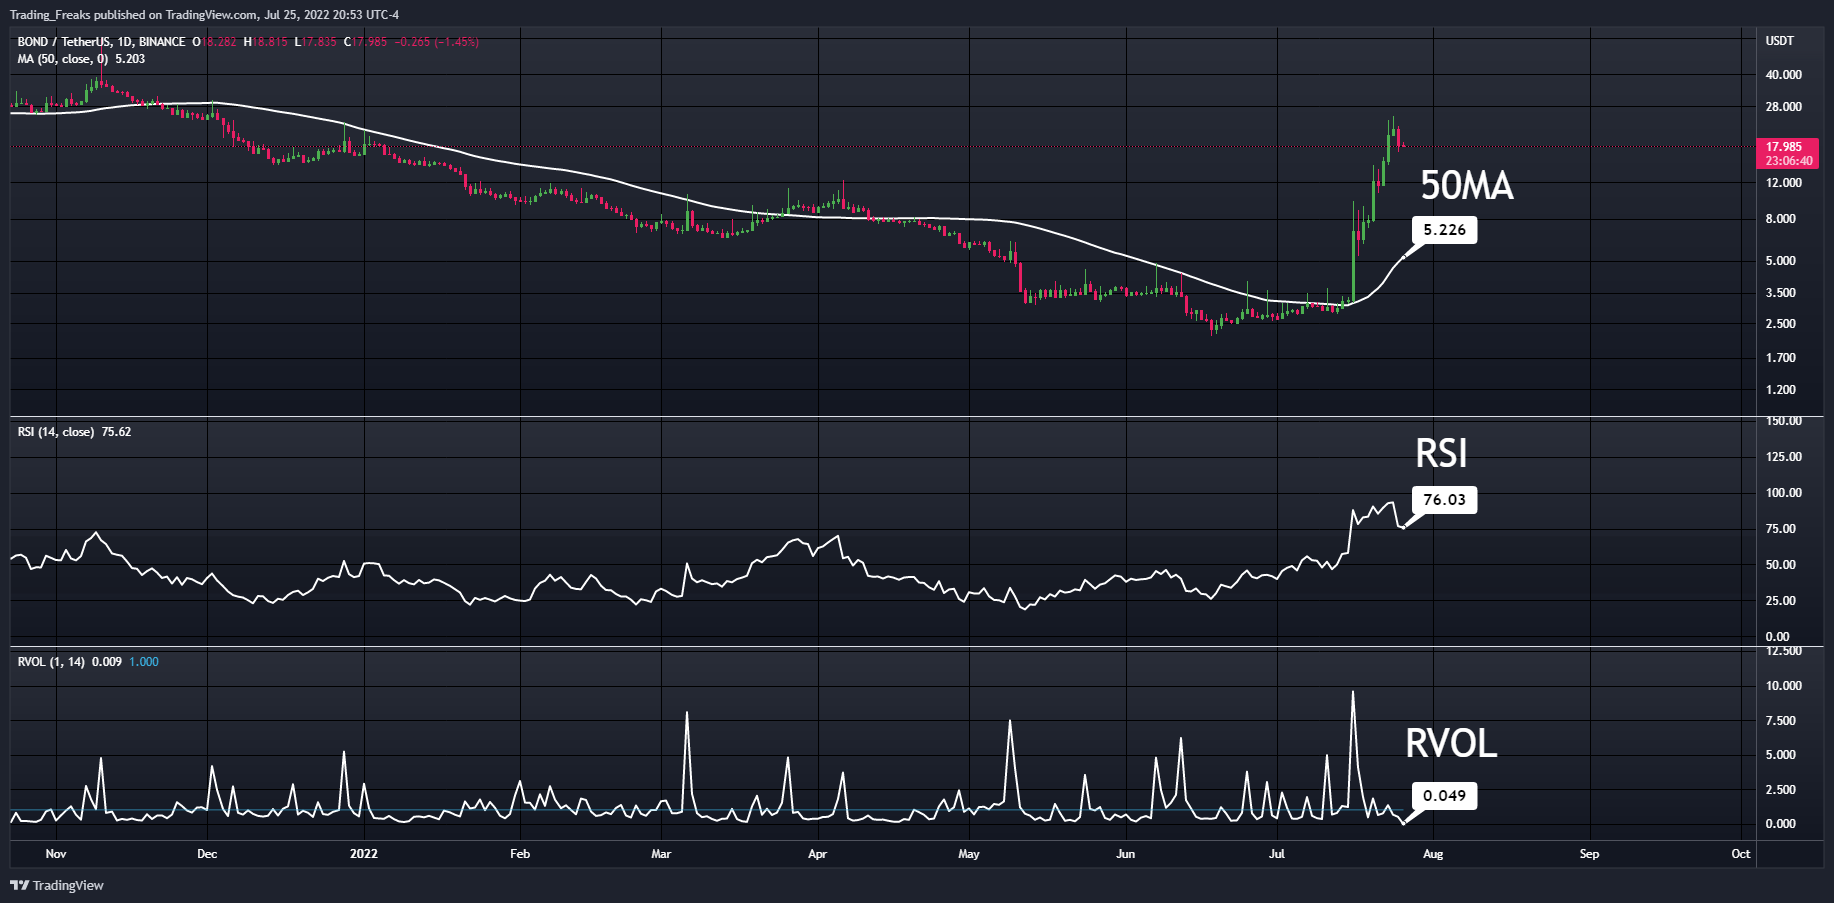
BOND/USDT RVOL, MA, RSI (Source: Tradingview)
Moreover, the Moving Average (MA) of BarnBridge (BOND) is shown in the above chart. Notably, the BOND price lies above 50 MA (short-term), so it is completely in an uptrend. Currently, BOND is in a bullish state. There is a possibility of a reversal trend of BOND at any time.
Meanwhile, the relative strength index (RSI) of the BOND is at a level of 76.03. This means that BOND is in an overbought state. However, this gives confidence to the traders to trade without any fear.
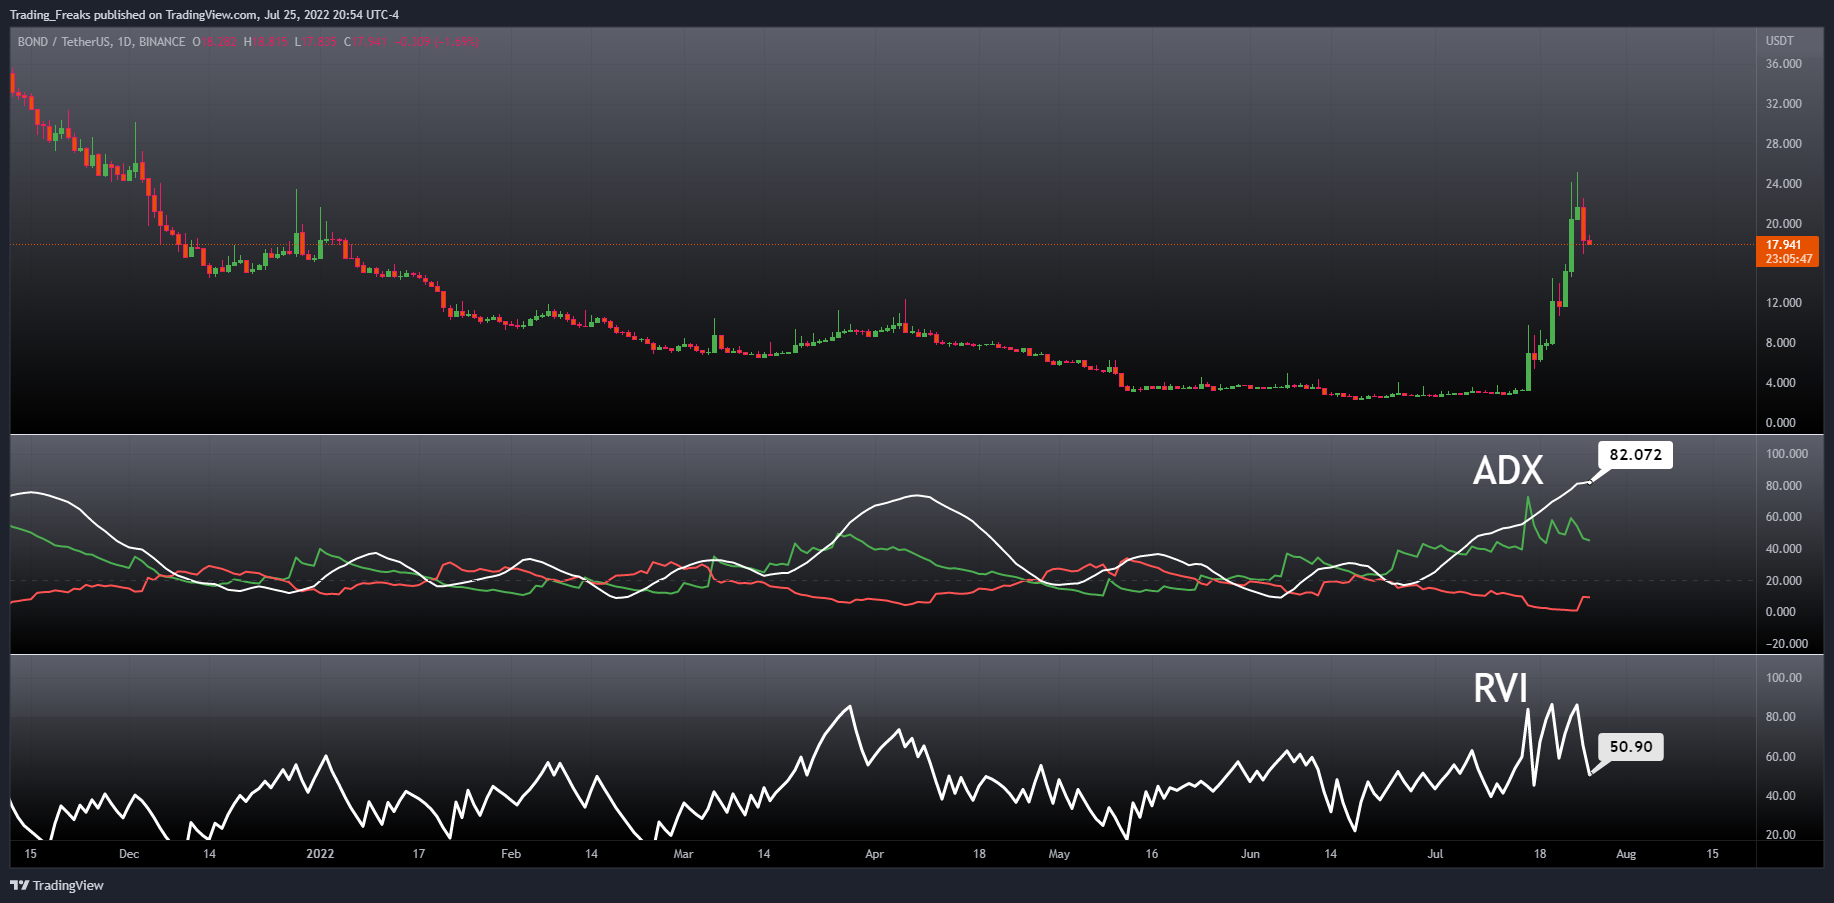
BarnBridge (BOND) Price Prediction 2022 — ADX, RVI
Let us now look Average Directional Index (ADX) of BarnBridge (BOND). It helps to measure the overall strength of the trend. The indicator is the average of the expanding price range values. This system attempts to measure the strength of price movement in the positive and negative directions using DMI indicators with ADX.

BOND/USDT ADX, RVI (Source: Tradingview)
The above chart represents the ADX of BarnBridge (BOND). Currently, BOND lies in the range of 82.072, indicating an extremely strong trend.
From the above chart, the Relative Volatility Index (RVI) of BarnBridge (BOND). RVI measures the constant deviation of price changes over a period of time. The RVI of BOND lies above 50, indicating high volatility. In fact, BOND’s RSI is at 76.03, thus confirming a potential sell signal.
Comparison of BOND with BTC, ETH
The below chart shows the price comparison between Bitcoin, Ethereum, and BarnBridge (BOND).
BTC Vs ETH Vs BOND Price Comparison (Source: Tradingview)
From the above chart, we can interpret that BOND is moving in the opposite direction with respect to BTC and ETH. That is, when the price of BTC and ETH increase, the price of BOND decreases. When the price of BTC and ETH decrease, the price of BOND increases.
BarnBridge (BOND) Price Prediction 2023
If the declining price action completely slows down in momentum and the trend reverses, BarnBridge (BOND)might probably attain $90 by 2023.
BarnBridge (BOND) Price Prediction 2024
With several upgrades in the network, BarnBridge (BOND) might enter a bullish trajectory. If the coin grabs the attention of major investors, BOND might rally to hit $130 by 2024.
BarnBridge (BOND) Price Prediction 2025
If BarnBridge (BOND) sustains major resistance levels and continues to be recognized as a better investment option among investors for the next 3 years, BOND would rally to hit $165.
BarnBridge (BOND) Price Prediction 2026
If BarnBridge (BOND) sustains major resistance levels and continues to be recognized as a better investment option among investors for the next 4 years, BOND would rally to hit $200.
BarnBridge (BOND) Price Prediction 2027
If BarnBridge (BOND) sustains major resistance levels and continues to be recognized as a better investment option among investors for the next 5 years, BOND would rally to hit $260.
BarnBridge (BOND) Price Prediction 2028
If BarnBridge (BOND) holds up a strong stance as a better investment option for the next 6 years, it might witness significant price rallies. Thus, by 2028, BOND would hit $295.
BarnBridge (BOND) Price Prediction 2029
If investors flock in and continue to place their bets on BarnBridge (BOND), it would witness major spikes. BOND might hit $330 by 2029.
BarnBridge (BOND) Price Prediction 2030
With greater advancements in the BarnBridge ecosystem, the crypto community might continue to invest in BarnBridge (BOND) for the next 8 years and drive significant price rallies for the token. Hence, BarnBridge (BOND) might hit $350 by 2030.
Conclusion
With continuous improvements in the BarnBridge network, we can say that 2022 is a good year for BOND. For this reason, the bullish price prediction of BarnBridge (BOND) in 2022 is $38.322. On the other hand, the bearish price prediction of BarnBridge (BOND) for 2022 is $4.051.
Furthermore, with the advancements and upgrades in the BarnBridge ecosystem, the performance of BarnBridge (BOND) might hit $60 gaining investors’ attention. It would also rise above its all-time high (ATH) of $185.69 in the near future.
FAQ
1. What is BarnBridge (BOND)?
BarnBridge (BOND) is the governance token of BarnBridge. BarnBridge is a DeFi risk tokenizing protocol that was launched in September 2020.
2. Where can you purchase BarnBridge (BOND)?
BarnBridge (BOND) has been listed on many crypto exchanges which include Binance, Uniswap (v2), ZB.COM, Coinbase, Gate.io, KuCoin, and LATOKEN.
3. Will BarnBridge (BOND) reach a new ATH soon?
With the ongoing developments and upgrades within the BarnBridge platform, BarnBridge (BOND) has a high possibility of reaching its ATH soon.
4. What is the current all-time high (ATH) of BarnBridge (BOND)?
On October 27, 2020, BarnBridge (BOND) reached its new all-time high (ATH) of $185.69.
5. Is BarnBridge (BOND) a good investment in 2022?
BarnBridge (BOND) seems to be one of the top-gaining cryptocurrencies this year. According to the recorded achievements of BarnBridge in the past few months, BOND is considered a good investment in 2022.
6. Can BarnBridge (BOND) reach $60?
BarnBridge (BOND) is one of the active cryptos that continues to maintain its bullish state. Eventually, if this bullish trend continues, BarnBridge (BOND) will hit $60 soon.
7. What will be BarnBridge (BOND) price by 2023?
BarnBridge (BOND) price is expected to reach $90 by 2023.
8. What will be BarnBridge (BOND) price by 2024?
BarnBridge (BOND) price is expected to reach $173 by 2024.
9. What will be BarnBridge (BOND) price by 2025?
BarnBridge (BOND) price is expected to reach $181 by 2025.
10. What will be BarnBridge (BOND) price by 2026?
BarnBridge (BOND) price is expected to reach $190 by 2026.
Disclaimer: The opinion expressed in this chart is solely the author’s. It does not represent any investment advice. TheNewsCrypto team encourages all to do their own research before investing.


 Bitcoin
  Ethereum
  Tether
  USDC
USDC  Dogecoin
  Cardano
  Bitcoin Cash
  Polygon
  Litecoin
  LEO Token
  Hedera
  Stellar
  Cosmos Hub
  OKB
OKB  Maker
Maker  Algorand
  NEO
NEO  Gate
Gate  KuCoin
  Synthetix Network
  IOTA
IOTA  Tether Gold
  TrueUSD
  Enjin Coin
  Holo
Holo  Ravencoin
  0x Protocol
  Siacoin
  Basic Attention
  Ontology
  Decred
  Zcash
Zcash  Waves
Waves  Lisk
Lisk  DigiByte
  Numeraire
  Status
  Nano
Nano  Pax Dollar
  Steem
Steem  OMG Network
  BUSD
BUSD  Ren
Ren  Bytom
Bytom  Bitcoin Diamond
  HUSD
HUSD  Energi
  Augur
Augur