


Binance Coin (BNB) Gears up for Breakout Attempt Above $330

Binance Coin (BNB) is following an ascending support line and is approaching the $330 area, potentially making another attempt at breaking out.
BNB has been moving upwards since reaching a low of $183.40 on June 18. The upward movement caused a breakout from a descending resistance line on July 29. At the time of the breakout, the line had been in place for 264 days.
Breakouts from such long-term structures usually lead to a sustained upward movement. However, that was not the case here, since the price decreased shortly after the breakout.
RSI breakdown
The daily RSI also fails to confirm the legitimacy of the breakout, since the indicator has broken down from an ascending support line.
However, it is currently making an attempt at moving above 50, something which would be considered a bullish development.
So, there are mixed signs in the daily time frame, coming from both the price action and indicator readings.
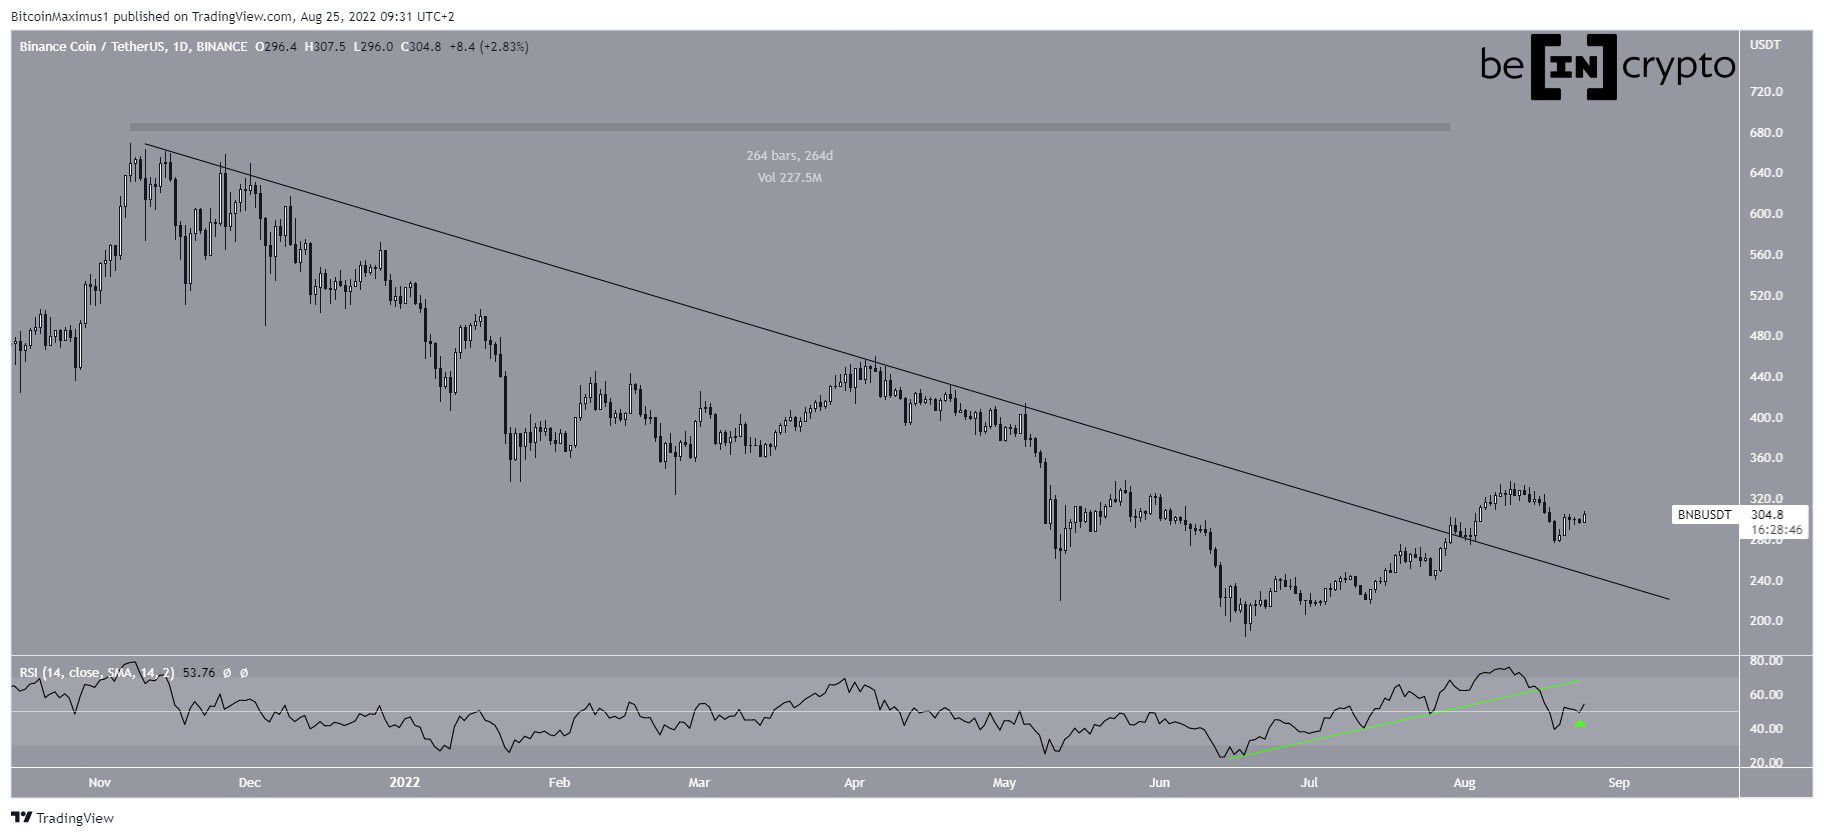
BNB/USDT Chart By TradingView
Breakout attempt
A closer look at the daily movement shows that the main resistance area is at $330. The area has caused three rejections until now (red icons).
Currently, BNB is following an ascending support line and is approaching the area once more, potentially making another attempt at breaking out.
A breakout above the $330 area would be expected to take the price towards the next resistance at $400. Conversely, a decrease below the ascending support line would indicate that new lows will follow.
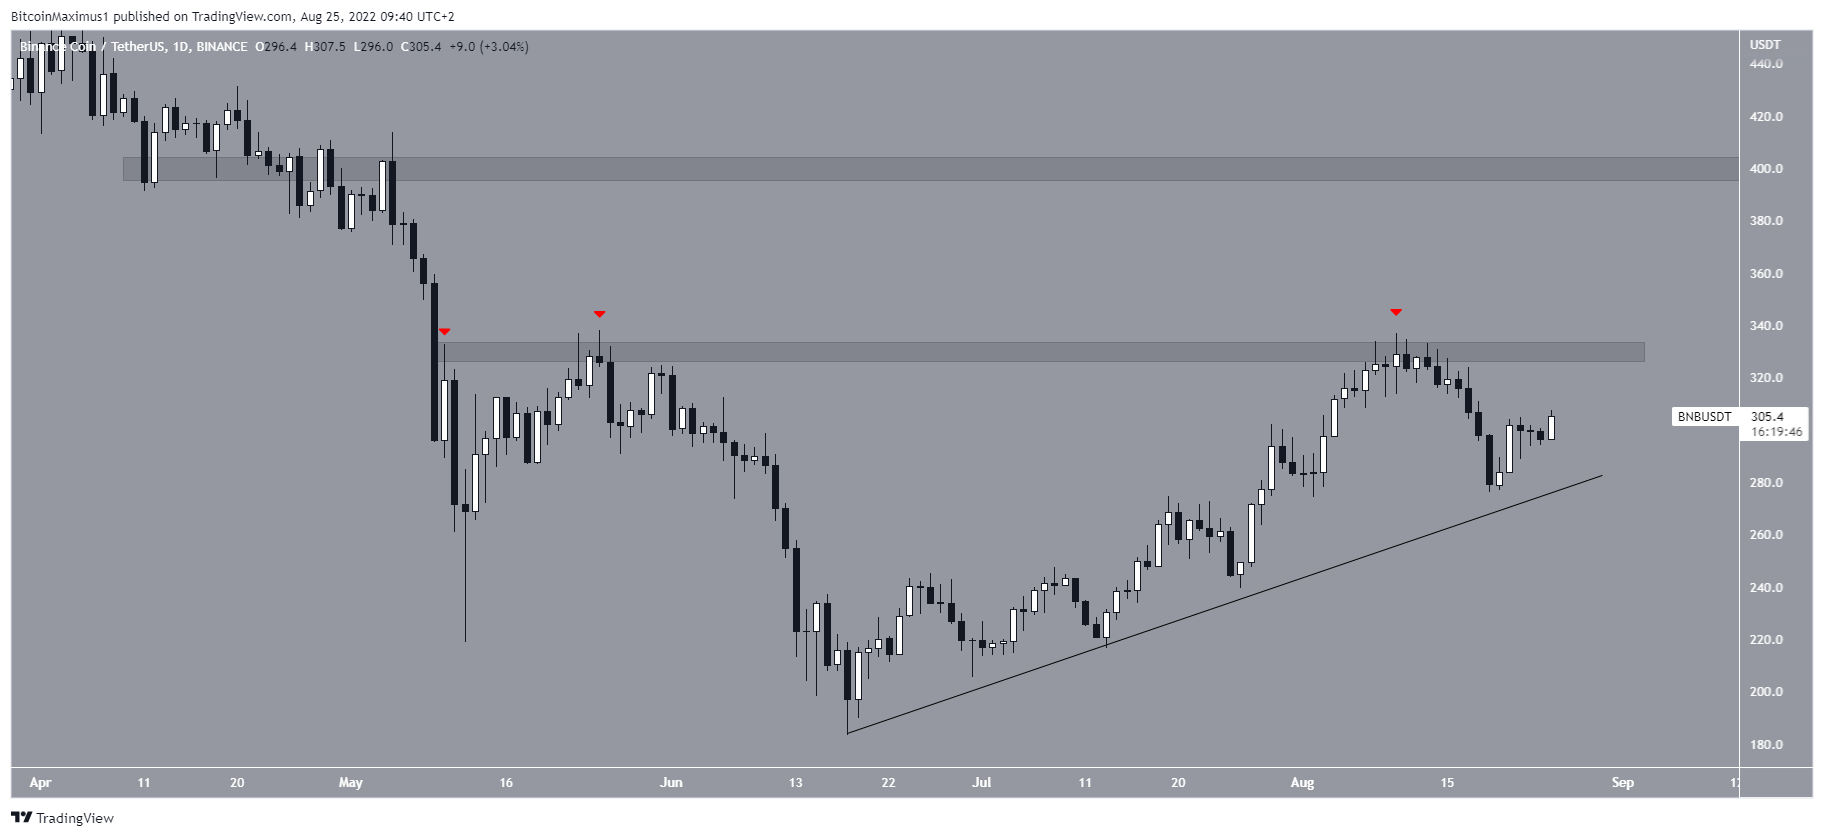
BNB/USDT Chart By TradingView
BNB/BTC
News account @BSC_Daily tweeted a chart that shows BNB has reached a new all-time high relative to BTC.
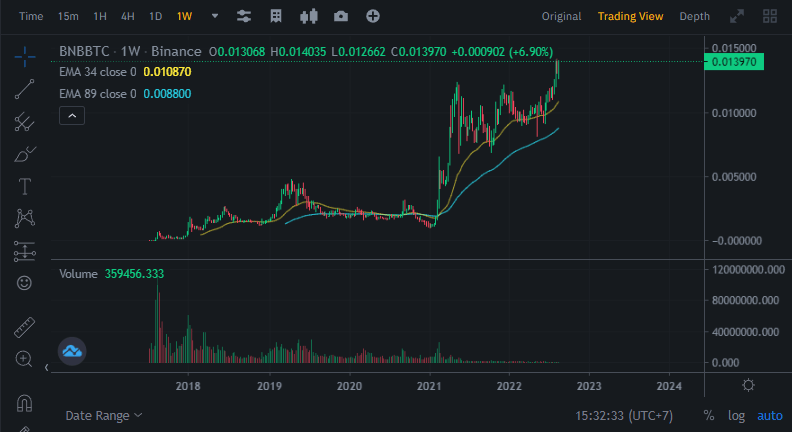
Source: Twitter
BNB reached an all-time high of ₿0.0142 on Aug 22. If the upward movement continues, the next resistance area would be at ₿0.0157, created by the 1.61 external Fib retracement resistance level. It is possible that the price will reach it.
However, there is a growing bearish divergence in the weekly RSI (green line). So, if the divergence is not invalidated by the time BNB reaches resistance, something which seems unlikely, it would be possible for the price to reach a local high there and then begin a downward movement.
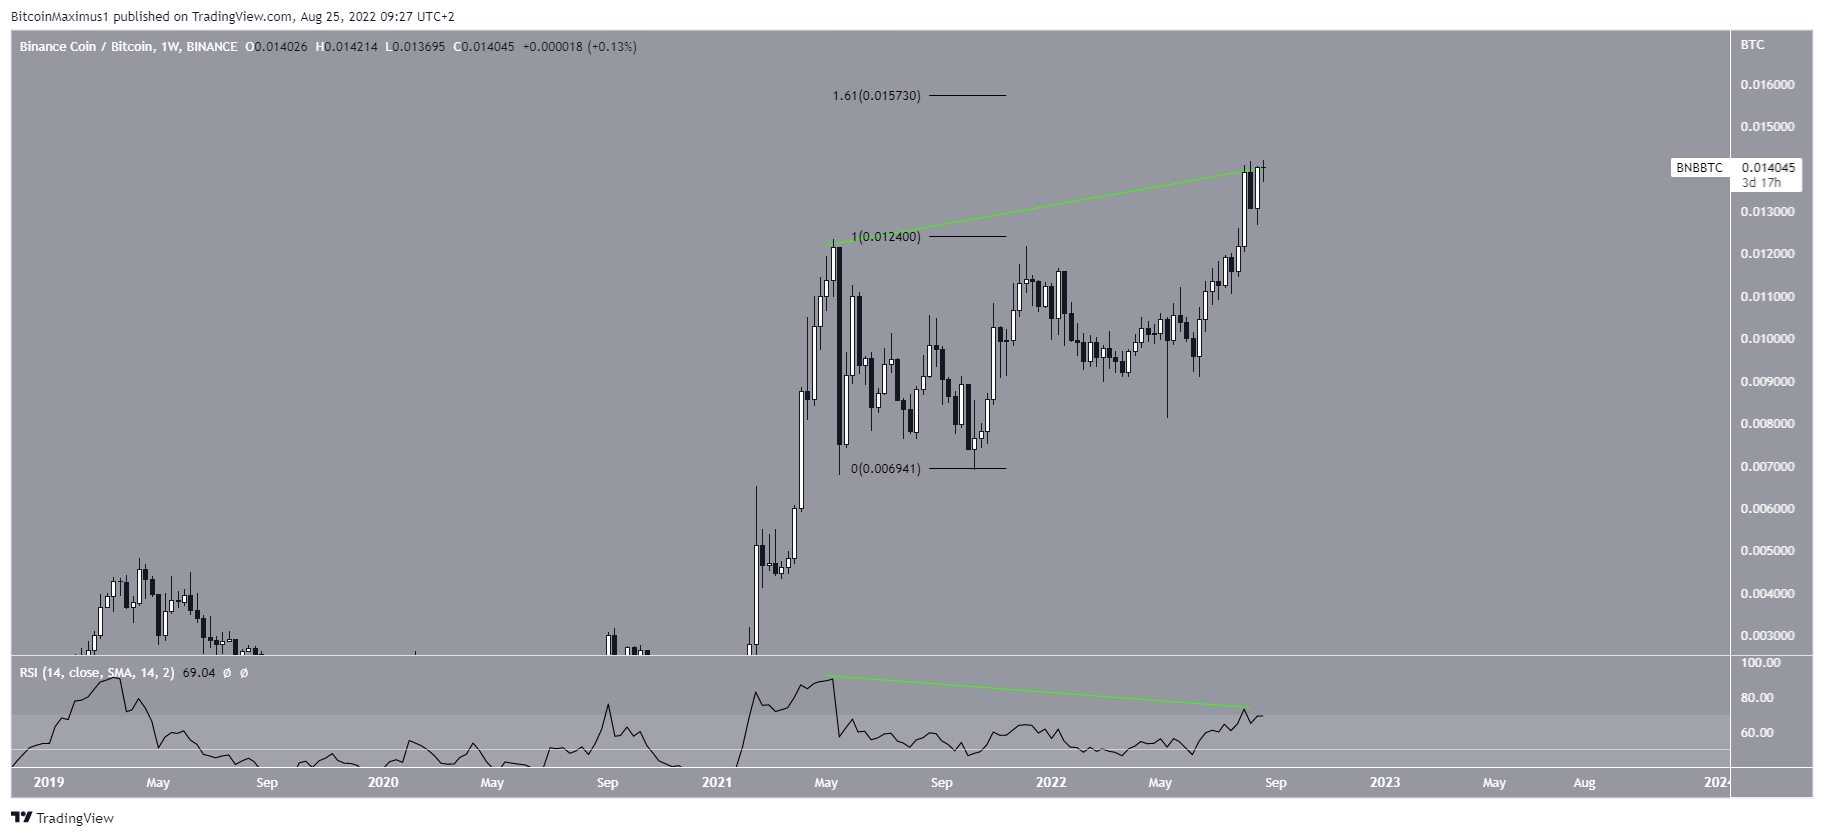
BNB/BTC Chart By TradingView
For Be[in]Crypto’s latest Bitcoin (BTC) analysis, click here


 Bitcoin
  Ethereum
  Tether
  USDC
USDC  Dogecoin
  Cardano
  Bitcoin Cash
  Polygon
  Litecoin
  LEO Token
  Hedera
  Stellar
  Cosmos Hub
  OKB
OKB  Maker
Maker  Algorand
  NEO
NEO  Gate
Gate  KuCoin
  Synthetix Network
  IOTA
IOTA  Tether Gold
  TrueUSD
  Enjin Coin
  Holo
Holo  Ravencoin
  Siacoin
  0x Protocol
  Basic Attention
  Ontology
  Decred
  Zcash
Zcash  Lisk
Lisk  Waves
Waves  DigiByte
  Numeraire
  Status
  Nano
Nano  Pax Dollar
  Steem
Steem  OMG Network
  BUSD
BUSD  Ren
Ren  Bytom
Bytom  Bitcoin Diamond
  HUSD
HUSD  Energi
  Augur
Augur