


Binance Coin price analysis: Can the bulls break above the $275 resistance?

TL;DR Breakdown
- Binance Coin price analysis suggests an upwards movement to $300
- BNB faces resistance at the $271 mark
- The closest support level lies at $258
The Binance Coin price analysis shows that BNB has climbed above the $250.00 mark and approaches the $275 price level as the bulls charge through
The broader cryptocurrency market observed a bullish market sentiment over the last 24 hours as most major cryptocurrencies record positive price movements. Major players include ADA and BNB, recording an 8.07 and a 5.07 percent incline, respectively.
Binance Coin price analysis: BNB finds resistance at $270
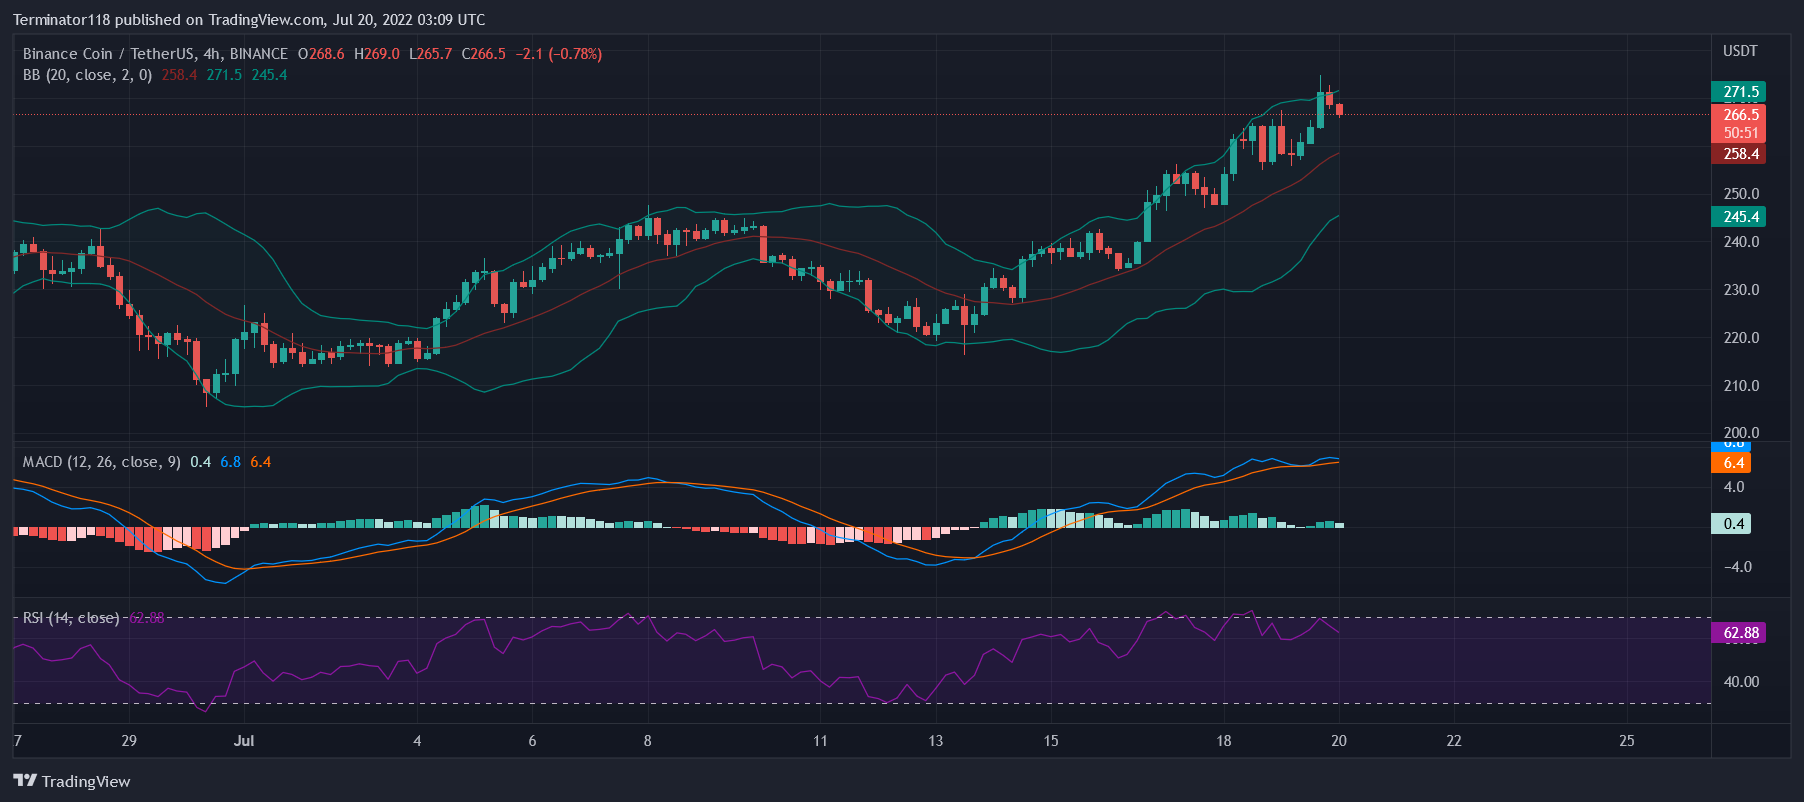
Technical indicators for BNB/USDT by Tradingview
The MACD is currently bullish, as expressed in the green color of the histogram. Moreover, the indicator shows strong bullish momentum as expressed in the height of the histogram. Furthermore, the dark shade suggests an increasing momentum as the buying pressure continues to increase in recent hours, with BNB approaching the $270.00 mark
The EMAs are currently trading high above the mean position as net price movement over the last seven days remains positive. However, as the markets observe selling activity, the EMAs show signs of a bearish convergence, with the 12-EMA moving downwards to reflect the recent price movements.
The RSI has been trading very high in the neutral region for the past three days as BNB observed strong bullish activity over the short-term charts. However, the index dropped to the 60.00 level today as BNB faced resistance at the $270 mark. At press time, the indicator moves downwards suggesting bearish pressure at the price level while the high position leaves low room for further upwards movement.
The Bollinger Bands have been wide for the last couple of days as the price volatility continued to increase. Today, the bands continue to diverge as the price breaks above the upper limit of the indicator. Currently, the indicator’s mean line provides support at the $258.4 mark while the upper limit acts as a resistance level at the $271.5 price level.
Technical analyses for BNB/USDT
Overall, the 4-hour Binance Coin price analysis issues a buy signal, with 14 of the 26 major technical indicators supporting the bulls. On the other hand, only three of the indicators support the bears showing a low bearish presence in recent hours. At the same time, nine indicators sit on the fence and support neither side of the market.
The 24-hour Binance Coin price analysis share this sentiment and issues a buy signal with 11 indicators suggesting an upwards movement against seven indicators suggesting a downwards movement. The analysis shows the bullish dominance across the mid-term charts while showing significant selling pressure for the asset across the same timeframe. Meanwhile, eight indicators remain neutral and do not issue any signals at press time.
What to expect from Binance Coin price analysis?
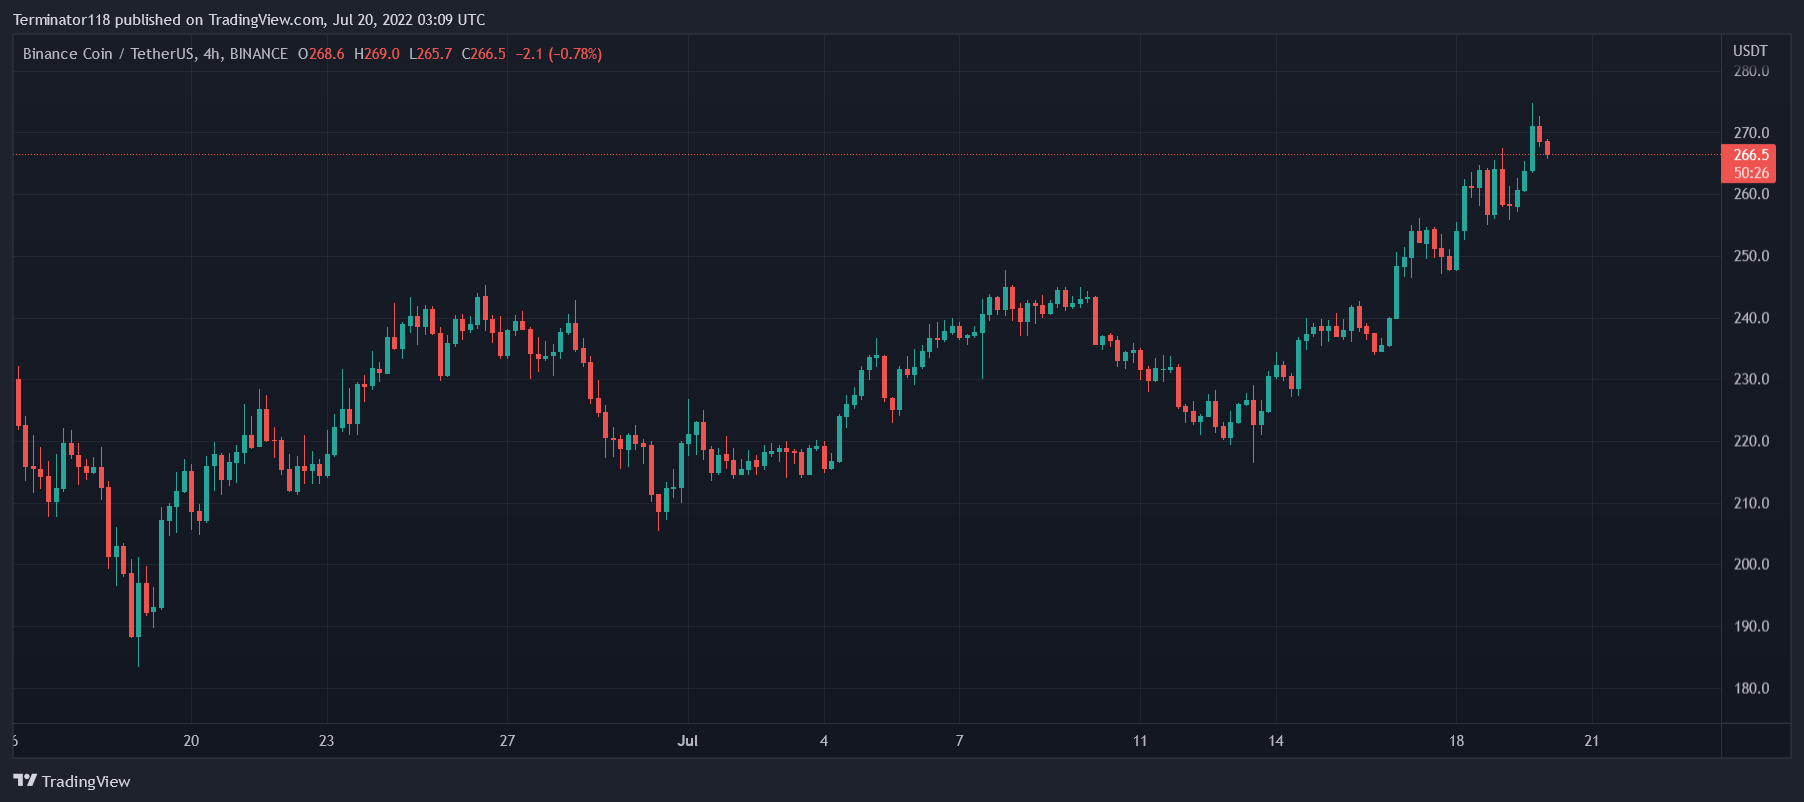
4-hour price chart by Tradingview
The Binance Coin price analysis shows that Binance is observing a mid-term bullish rally, with the price steadily climbing from the $220 mark to the current high of $275. While the price faces resistance at the $270 mark, the strong bullish momentum suggests further upwards movement for the asset.
Traders should expect BNB to break above the $275.00 mark in the next two days as BNB approaches the $300 price level. The suggestion is reinforced by the mid-term technical analyses, both of which are bullish at press time.


 Bitcoin
  Ethereum
  Tether
  USDC
USDC  Dogecoin
  Cardano
  Bitcoin Cash
  Polygon
  Litecoin
  LEO Token
  OKB
OKB  Stellar
  Cosmos Hub
  Hedera
  Maker
Maker  Algorand
  NEO
NEO  Synthetix Network
  Gate
Gate  KuCoin
  IOTA
IOTA  Tether Gold
  TrueUSD
  Enjin Coin
  0x Protocol
  Ravencoin
  Holo
Holo  Siacoin
  Basic Attention
  Decred
  Zcash
Zcash  Ontology
  Lisk
Lisk  Waves
Waves  DigiByte
  Numeraire
  Status
  Nano
Nano  Pax Dollar
  Steem
Steem  OMG Network
  BUSD
BUSD  Ren
Ren  Bitcoin Diamond
  Bytom
Bytom  HUSD
HUSD  Energi
  Augur
Augur