


Bitcoin (BTC) Continues Consolidating Near $24,000 in Unclear Trend

Bitcoin (BTC) is trading inside a short-term corrective pattern. The direction of the short-term trend is still unclear.
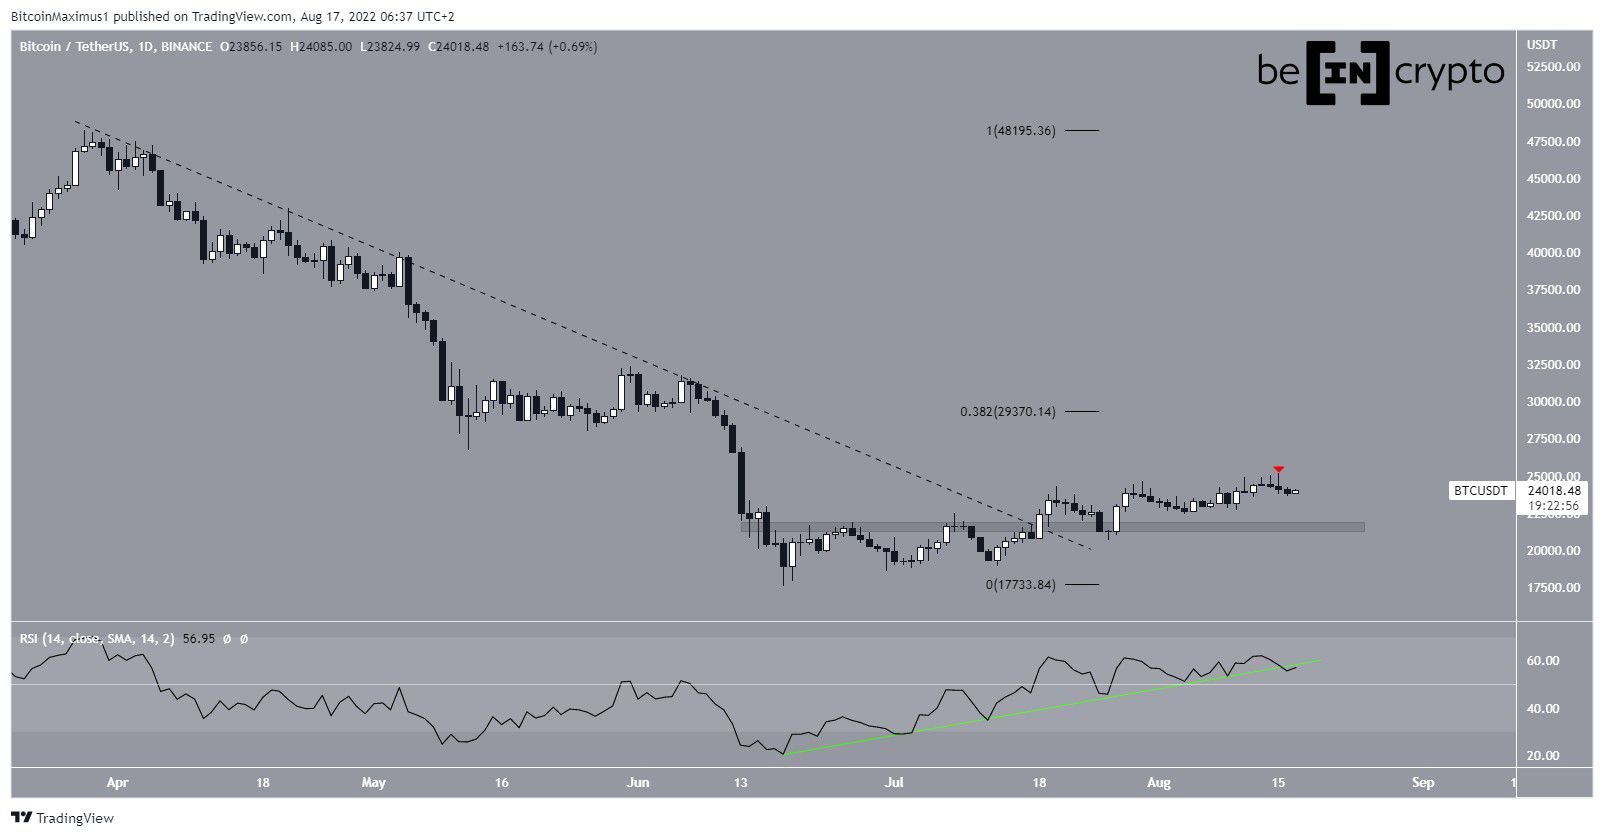
On July 18, Bitcoin broke out from a descending resistance line that had been in place since the end of March. The reaction after the breakout was relatively weak — Bitcoin failed to even reach the 0.382 Fib retracement resistance level at $29,370.
While BTC reached a local high of $25,211 on Aug. 15, it created a long upper wick (red icon) and has been mostly falling since.
More importantly, the bullish divergence trendline in the daily RSI (green line) that preceded the upward move has now been broken. This is a sign that often precedes price decreases.
If BTC continues to fall, the closest support area would likely be found at $21,550.
BTC/USDT Chart By TradingView
Short-term pattern
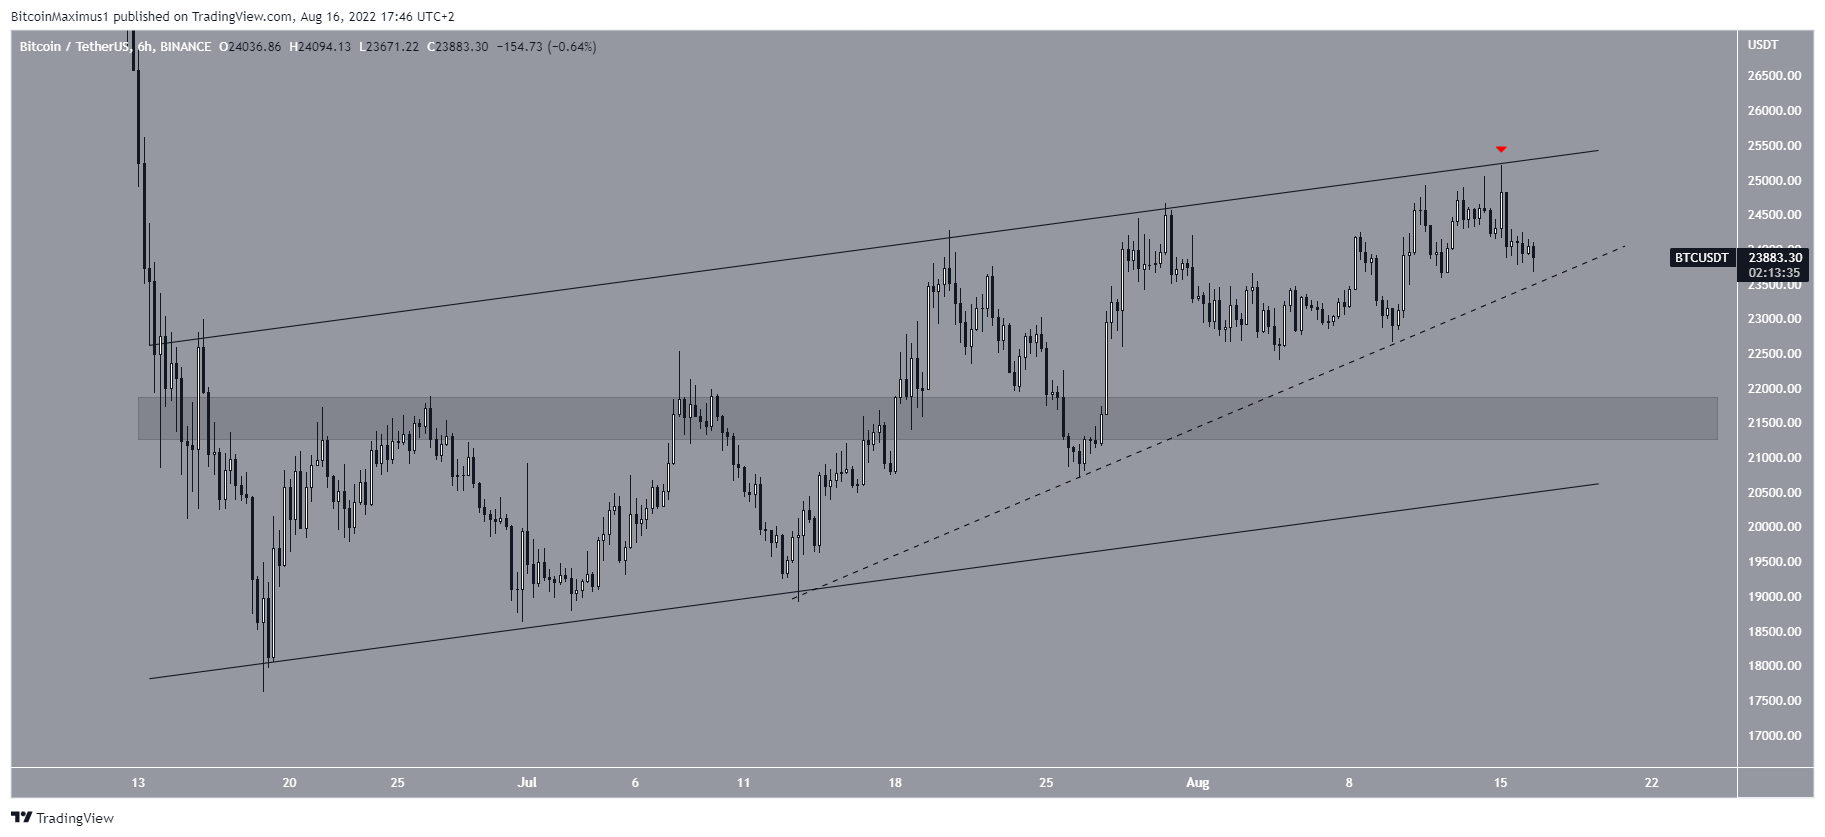
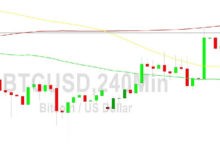
The six-hour chart shows that BTC is trading inside an ascending parallel channel since reaching a low on June 18. Such channels usually contain corrective movements, meaning that an eventual breakdown from it would be expected.
Bitcoin was rejected by the resistance line of the channel on Aug. 15 (red icon) and has been falling since.
If it breaks down from the short-term ascending support line (dashed), a decrease towards the aforementioned $21,500 support area would be expected. This area also coincides with the support line of the channel.
BTC/USDT Chart By TradingView
BTC wave count analysis
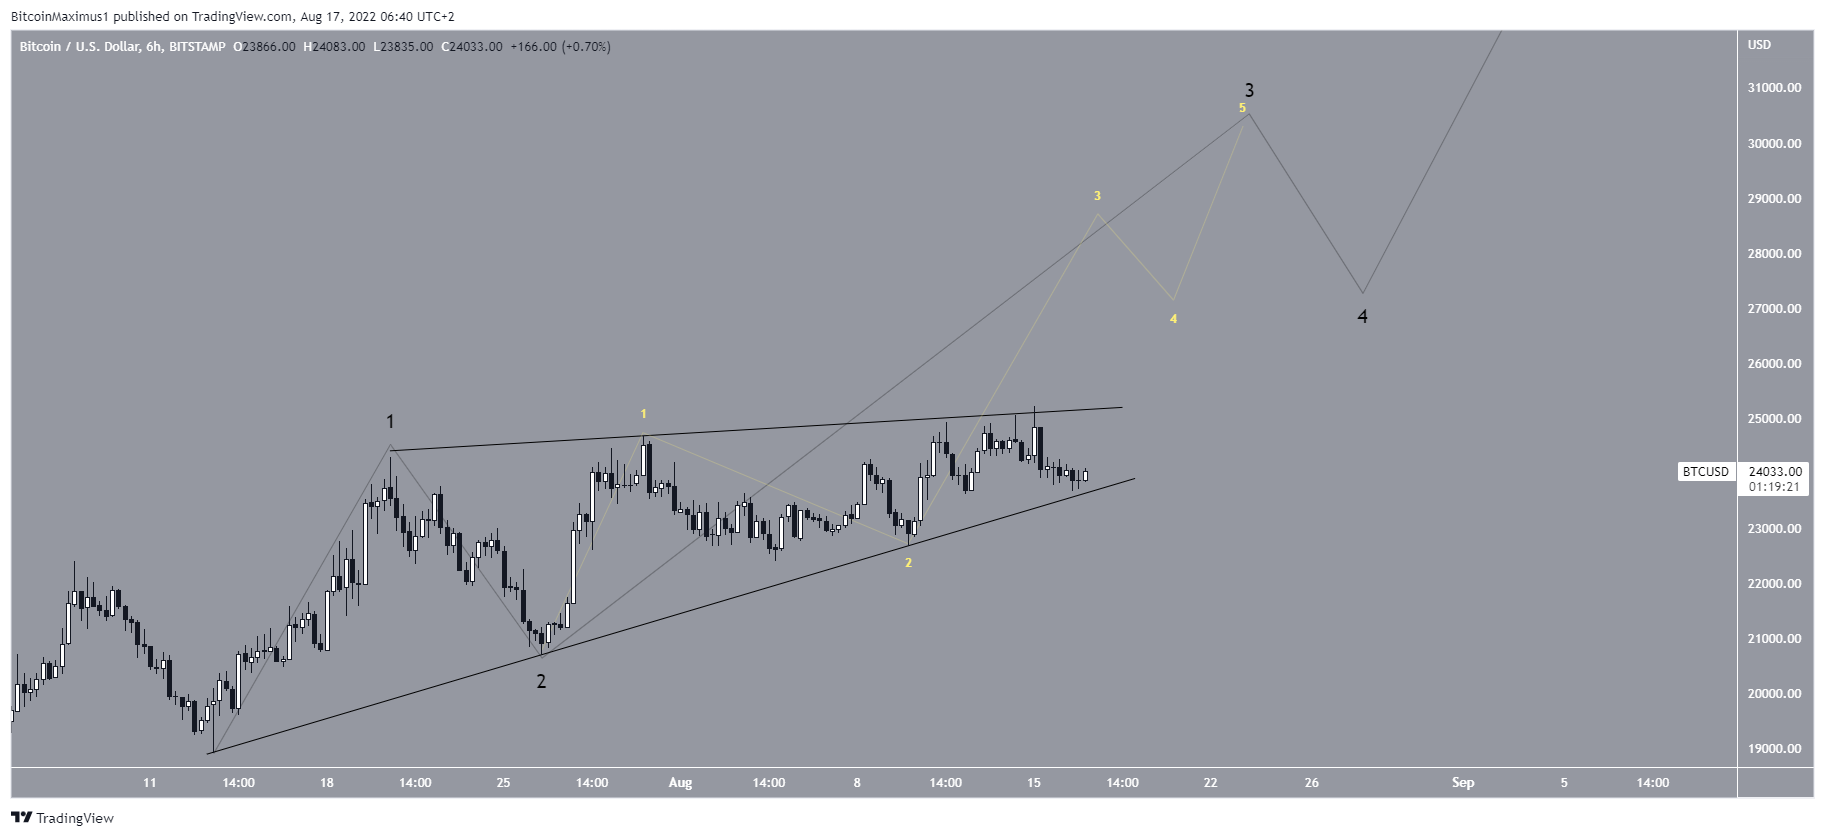
There are two potential short-term wave counts for the future trend.
The first suggests that BTC began a five-wave upward move (black) on July 13 and is currently in wave three. The sub-wave count is shown in yellow, where Bitcoin appears to be in sub-wave three. In order for this possibility to remain valid, the price has to hold on above the slope of the current ascending support line.
BTC/USD Chart By TradingView
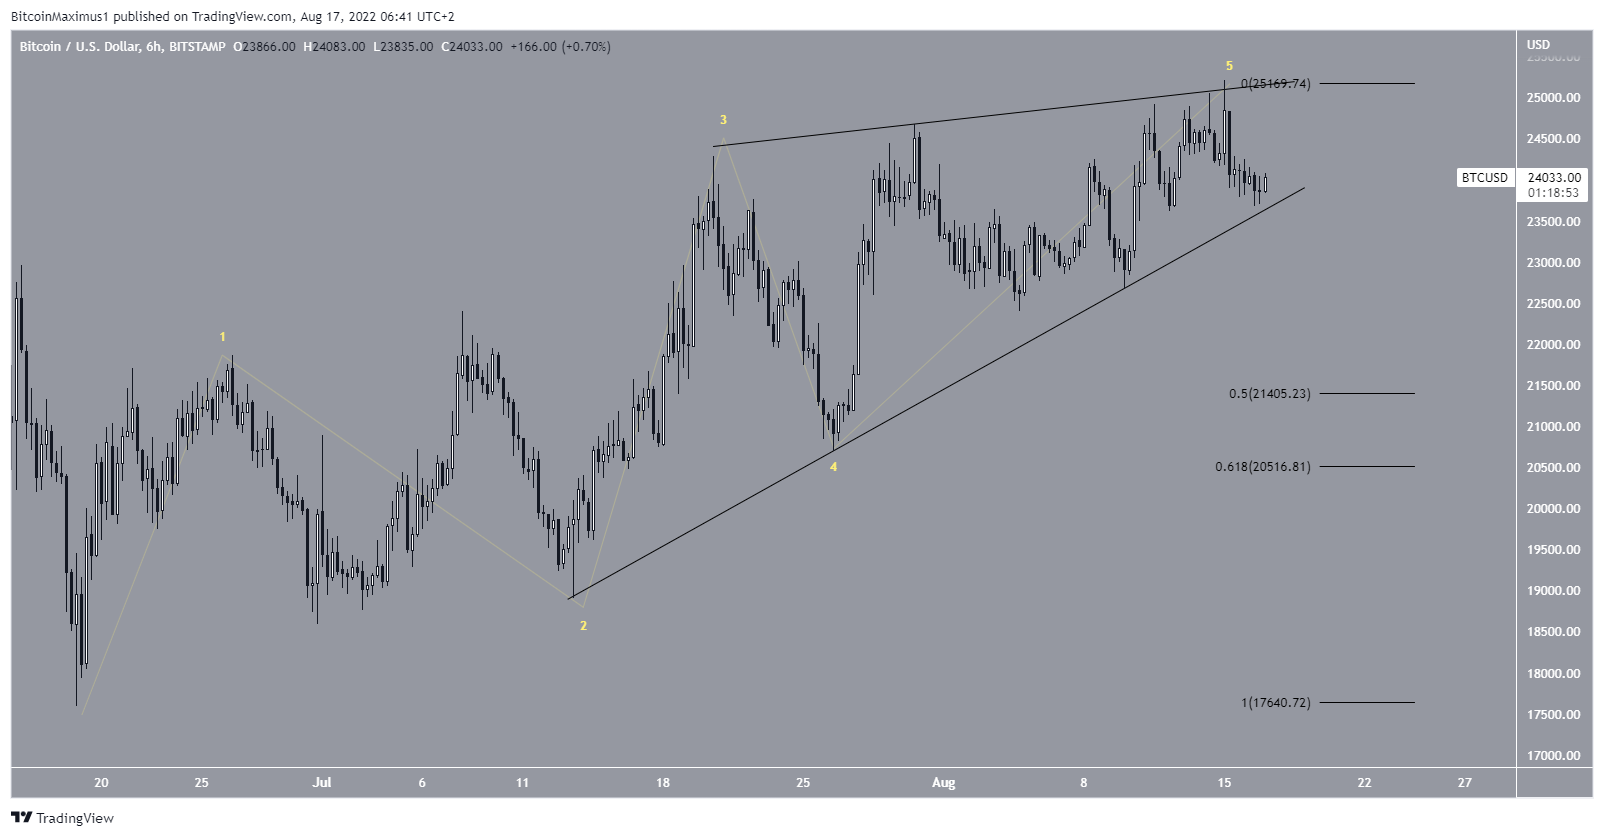
The second short-term count suggests that Bitcoin has completed wave five of a leading diagonal, thus shaping the ascending wedge. In this case, a breakdown from the wedge and subsequent decrease towards the 0.5-0.618 Fib retracement support levels between $20,500 and $21,400 would be expected prior to the continuation of the upward move.
To conclude, both the short-term counts and the most likely long-term wave count suggest that a bottom has already been reached.
BTC/USD Chart By TradingView
For Be[in]Crypto’s previous Bitcoin (BTC) analysis, click here


 Bitcoin
  Ethereum
  Tether
  USDC
USDC  Dogecoin
  Cardano
  Bitcoin Cash
  Polygon
  Litecoin
  LEO Token
  OKB
OKB  Stellar
  Cosmos Hub
  Hedera
  Maker
Maker  Algorand
  NEO
NEO  Synthetix Network
  Gate
Gate  KuCoin
  IOTA
IOTA  Tether Gold
  TrueUSD
  Enjin Coin
  0x Protocol
  Ravencoin
  Siacoin
  Holo
Holo  Basic Attention
  Ontology
  Decred
  Zcash
Zcash  Waves
Waves  Lisk
Lisk  DigiByte
  Numeraire
  Status
  Pax Dollar
  Nano
Nano  Steem
Steem  OMG Network
  BUSD
BUSD  Ren
Ren  Bitcoin Diamond
  Bytom
Bytom  HUSD
HUSD  Energi
  Augur
Augur