


Bitcoin (BTC) on-Chain Analysis: Lifespan Indicators Suggest Reversal Is Coming

Be[In]Crypto takes a look at Bitcoin (BTC) on-chain indicators, specifically the Spent Output Profit Ratio (SOPR) and the RHODL Ratio.
BTC SOPR
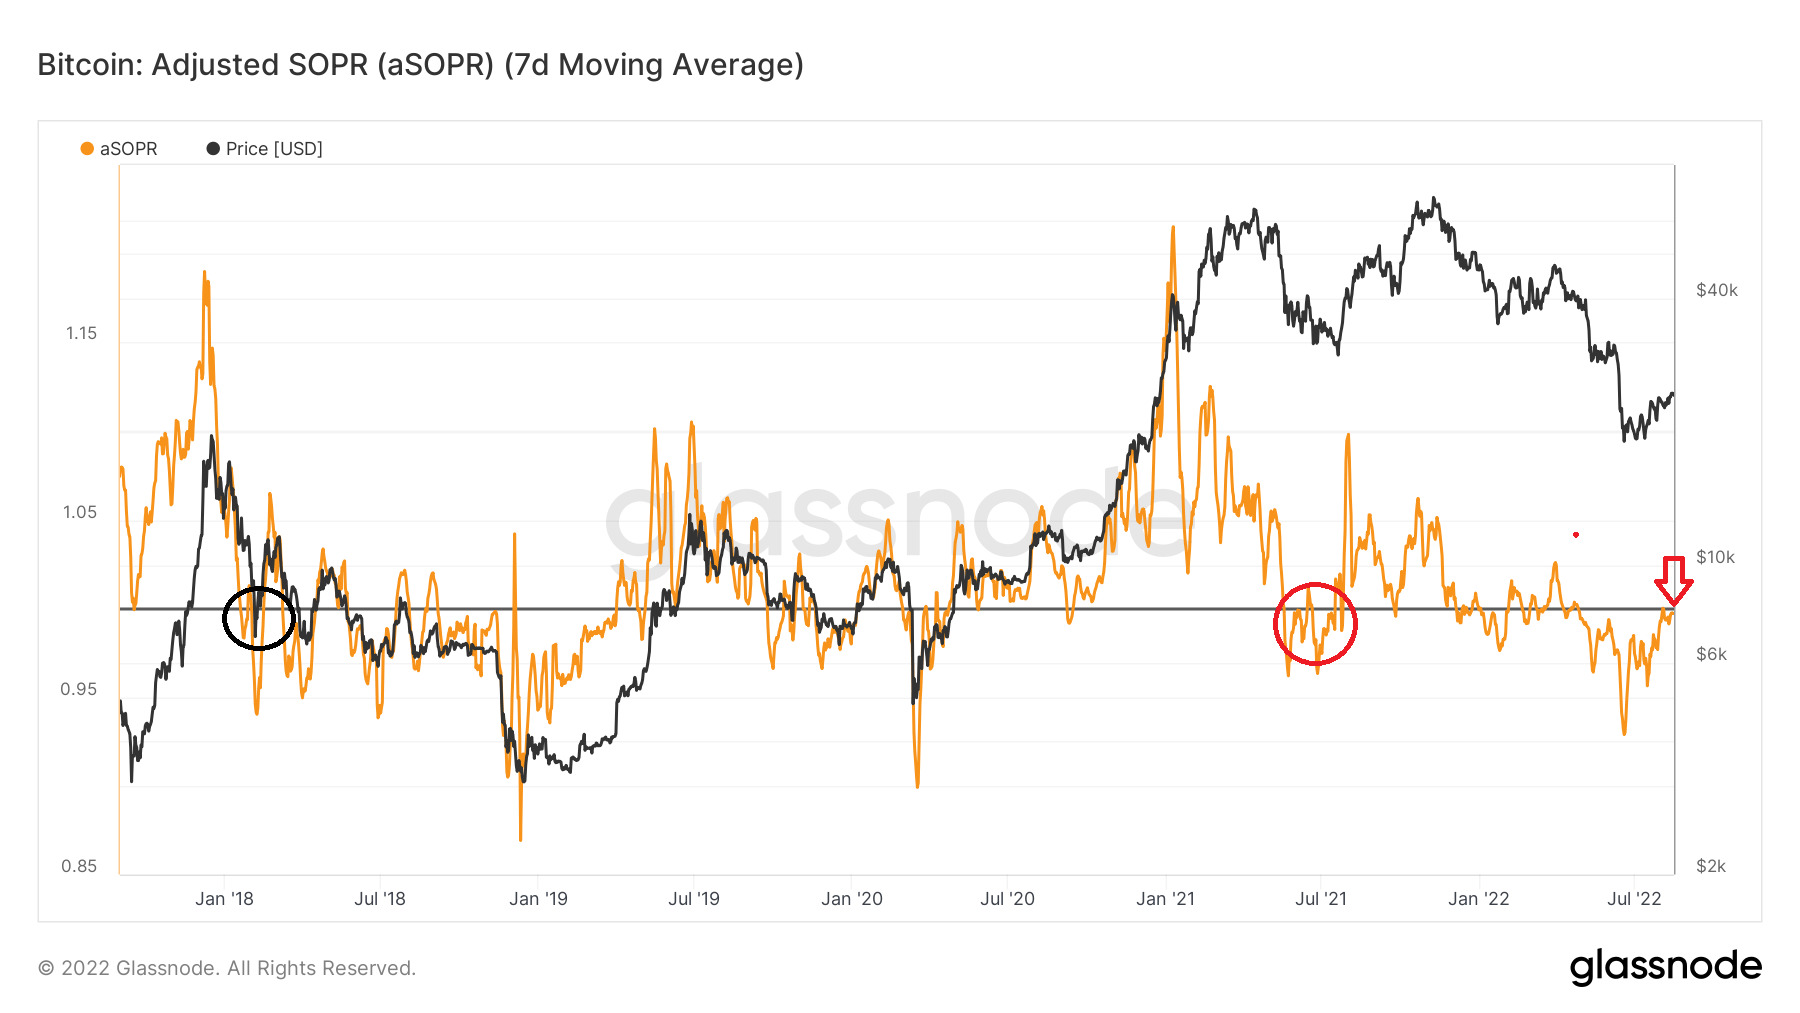
SOPR is an on-chain indicator that shows if the market is in a state of profit or loss. Readings above one (black line) show that the market is in aggregate profit, while those below one show aggregate loss.
The main characteristic of bullish trends is that SOPR bounces at the one line instead of falling below it.
SOPR broke down below one (black circle) in Jan. 2018. This suggested that the bullish trend had come to an end. Afterwards, the bottom was reached on Dec. 11 of the same year, at a reading of 0.86. The bottom was reached 11 months after the first breakdown.
In the current bull run, SOPR broke down below one in May 2021 (red circle). On June 18, it reached a value of 0.928. This is the third ever lowest value, being only higher than those on Dec 2018 and March 2020. The low was reached 13 months after SOPR first broke down below one.
After the 2018 bottom, SOPR moved above one on April 5, 2019. This confirmed that the bottom is in. Currently, SOPR made an attempt at breaking out above the one line on Aug. 5 (red arrow). While the attempt was unsuccessful, the indicator is gearing up for another breakout attempt.
If SOPR were to move above one, it would confirm that the bottom is in.
SOPR Chart By Glassnode
RHODL Ratio
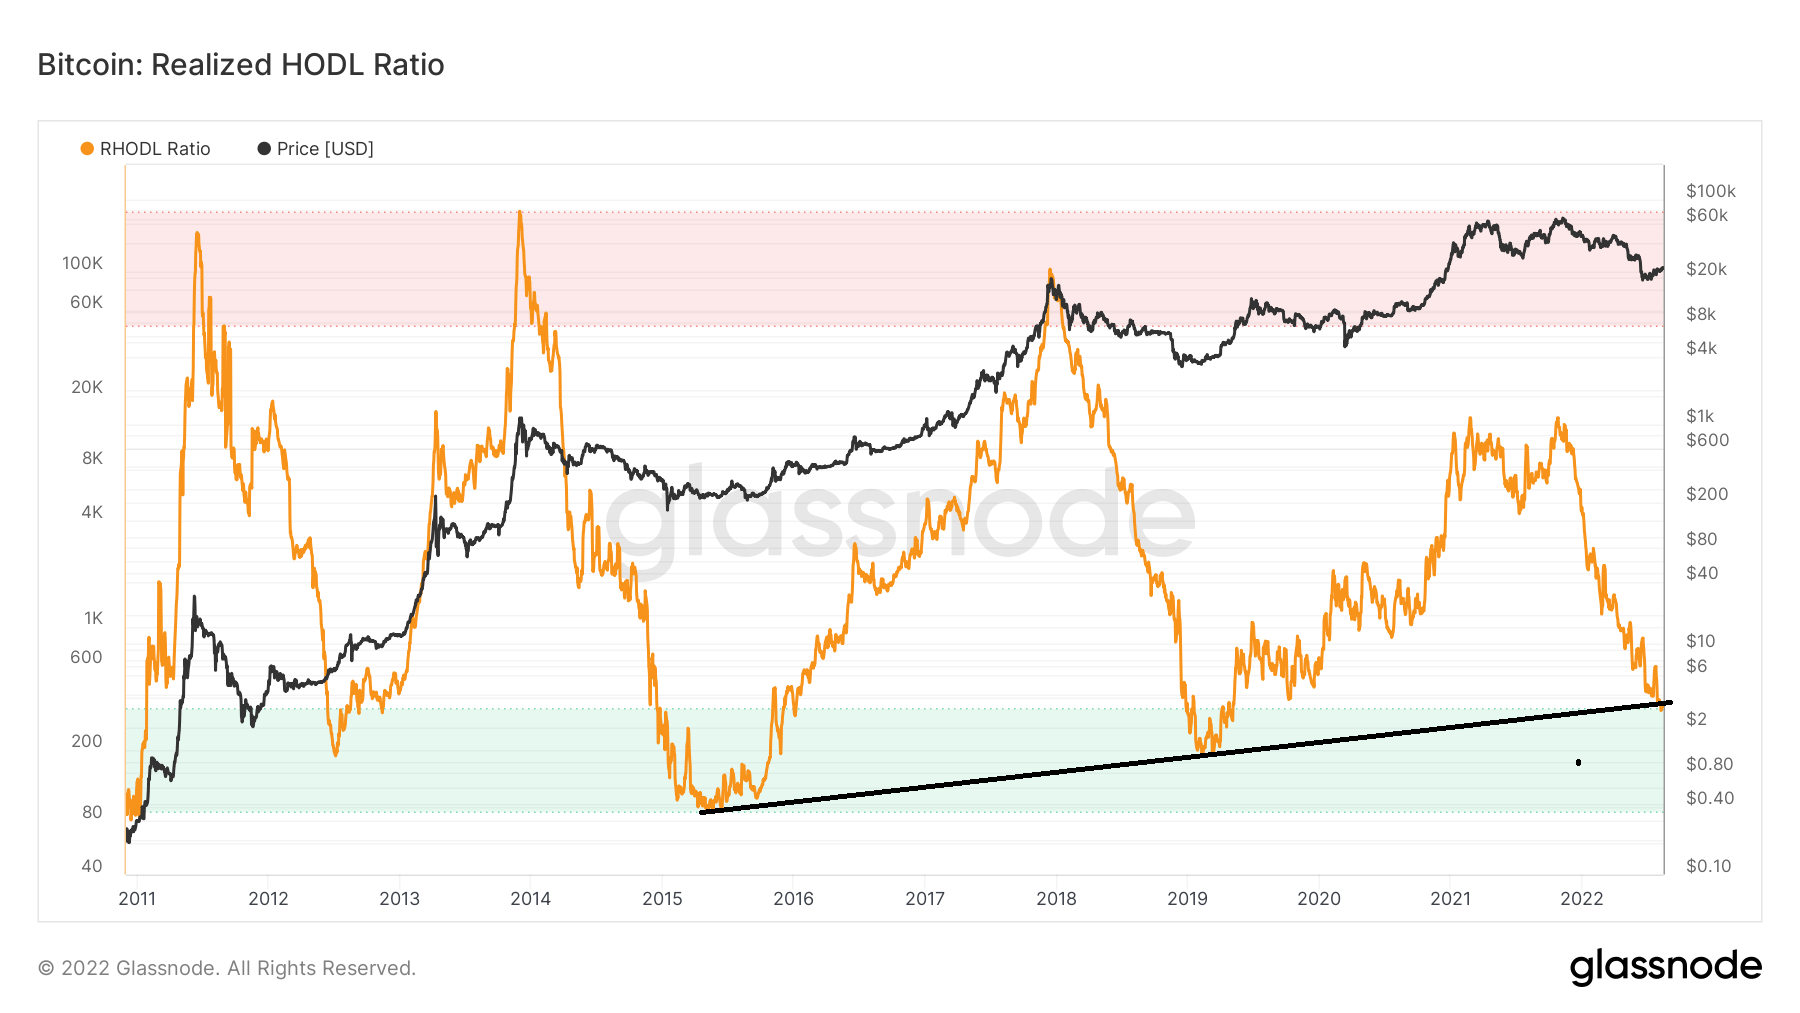
The RHODL ratio is an indicator that is created by the ratio between the one-week and the 1-2 year HODL Wave bands. Readings above 50,000 (highlighted in red) indicate that a significant percentage of the BTC supply is in the hands of short-term holders.
This reading is generally linked to tops, as was the case for the 2013 and 2017 peaks. However, this was not the case in the 2021 top, which was made at about 14,000.
The RHODL ratio is currently at 360, which is slightly above the 350 ratio that is considered oversold. It is worth mentioning that the RHODL ratio dropped below 350 on Aug 11 before eventually moving above it.
Historically, decreases into oversold territory and subsequent increases above it have been a sign of market bottoms.
Moreover, it is possible to draw an ascending support line connecting the 2015 and 2019 bottoms. If the line holds, it would suggest that the ratio has bounced at the line once more and confirmed the BTC market bottom.
RHODL Chart By Glassnode
For Be[in]Crypto’s latest Bitcoin (BTC) analysis, click here


 Bitcoin
  Ethereum
  Tether
  USDC
USDC  Dogecoin
  Cardano
  Bitcoin Cash
  Polygon
  Litecoin
  LEO Token
  OKB
OKB  Stellar
  Cosmos Hub
  Hedera
  Maker
Maker  Algorand
  NEO
NEO  Synthetix Network
  Gate
Gate  KuCoin
  IOTA
IOTA  Tether Gold
  TrueUSD
  Enjin Coin
  0x Protocol
  Ravencoin
  Holo
Holo  Siacoin
  Basic Attention
  Ontology
  Decred
  Zcash
Zcash  Lisk
Lisk  Waves
Waves  DigiByte
  Numeraire
  Status
  Nano
Nano  Pax Dollar
  Steem
Steem  OMG Network
  BUSD
BUSD  Ren
Ren  Bitcoin Diamond
  Bytom
Bytom  HUSD
HUSD  Energi
  Augur
Augur