


Bitcoin (BTC) on-Chain Analysis: Miner Indicators Show Capitulation

Be[in]Crypto takes a look at Bitcoin (BTC) on-chain indicators that relate to miners, more specifically the difficulty ribbon compression and hash ribbon.
Difficulty ribbon compression
The difficulty ribbon is an on-chain indicator that employs moving averages (MA) of the Bitcoin mining difficulty. Then, the difficulty ribbon compression adds a standard deviation on top of this in order to better determine if the market is close to bottoming.
Throughout its history, values between 0.01 and 0.02 have been associated with bottoms.
In 2022, the indicator crossed into oversold territory (<0.05) in May and is currently at 0.0162. The only other time it as lower than this was in Jan 2021 at 0.0137.
Interestingly, all three previous market cycle bottoms (black circles) were reached at higher values.
More specifically, the 2015 bottom was reached at 0.024, the 2018 bottom was reached at 0.019 and the 2020 one at 0.020.
As a result of these readings, the difficulty ribbon compression indicator suggests that BTC is close to a bottom.
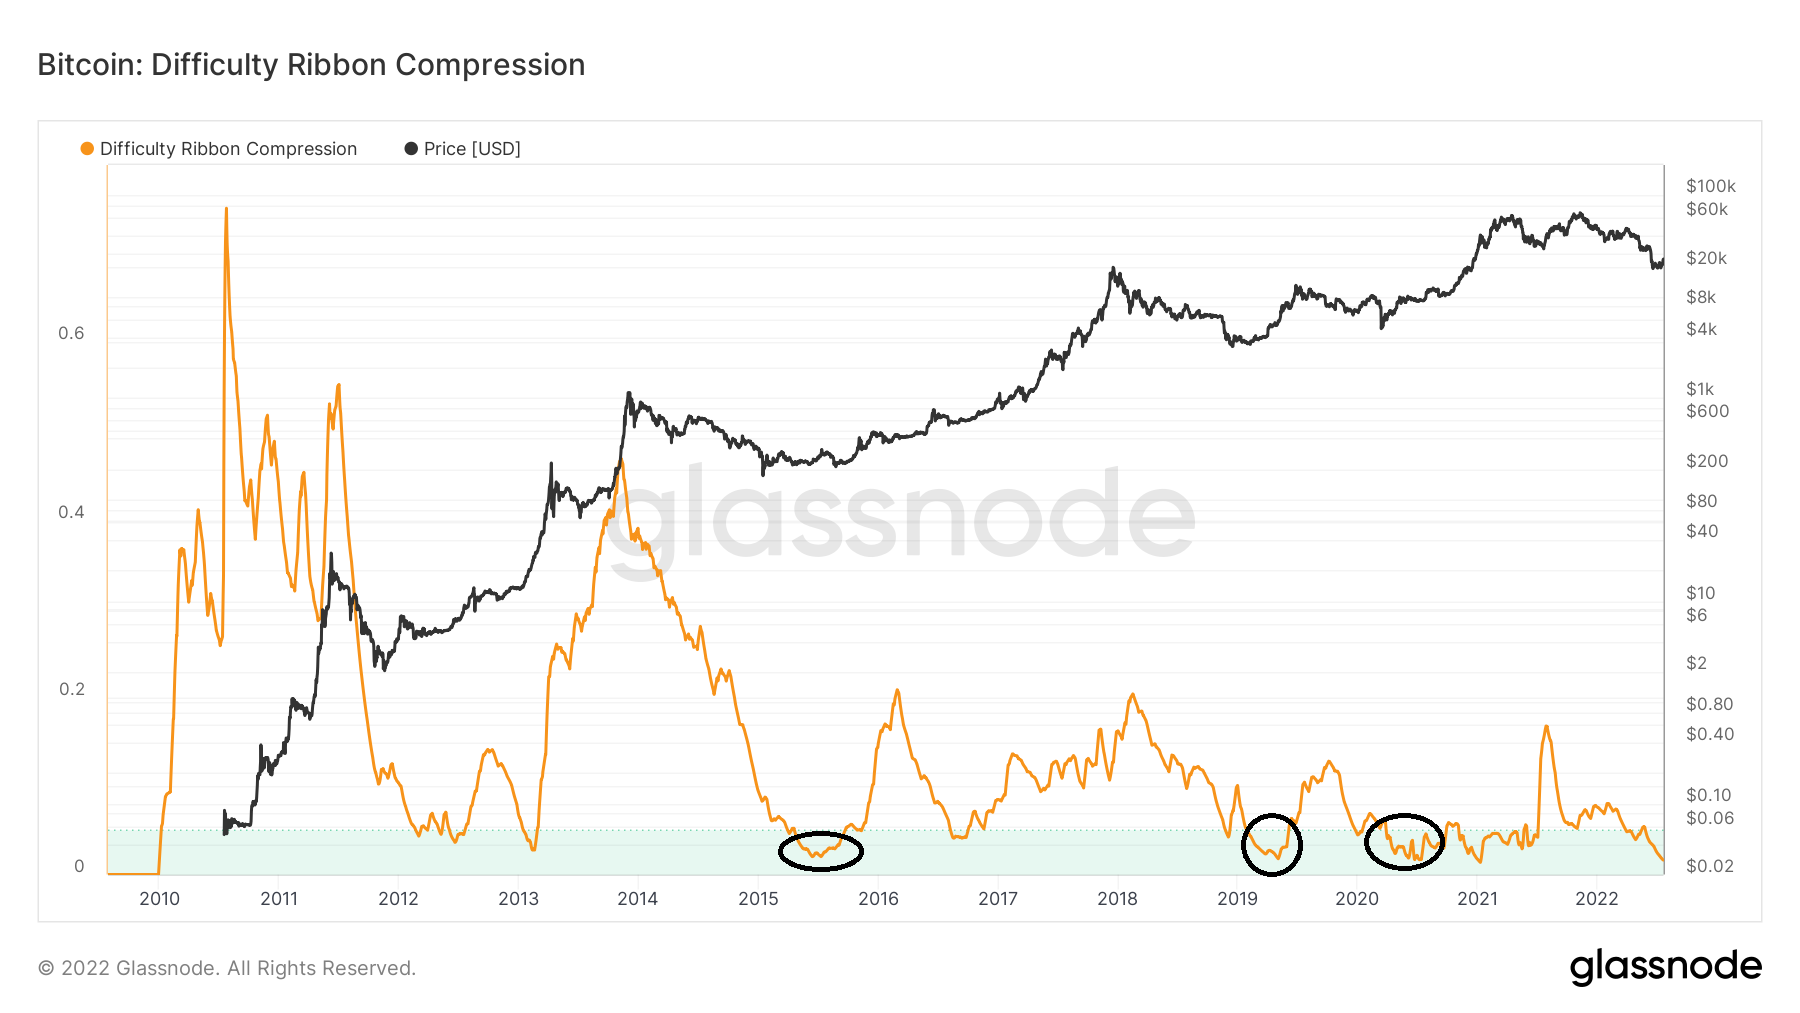
Difficulty Ribbon Chart By Glassnode
BTC hash ribbon
The hash ribbon indicator uses the hash rate to determine if miners have capitulated. Miner capitulation occurs when mining rewards are lower than costs.
In the chart, this is represented when the 30-day moving average (MA, green) crosses below the 60-day one (blue). This creates a light red area which turns to dark red when there is a bullish cross.
Historically, these crosses have been followed by significant upward movements.
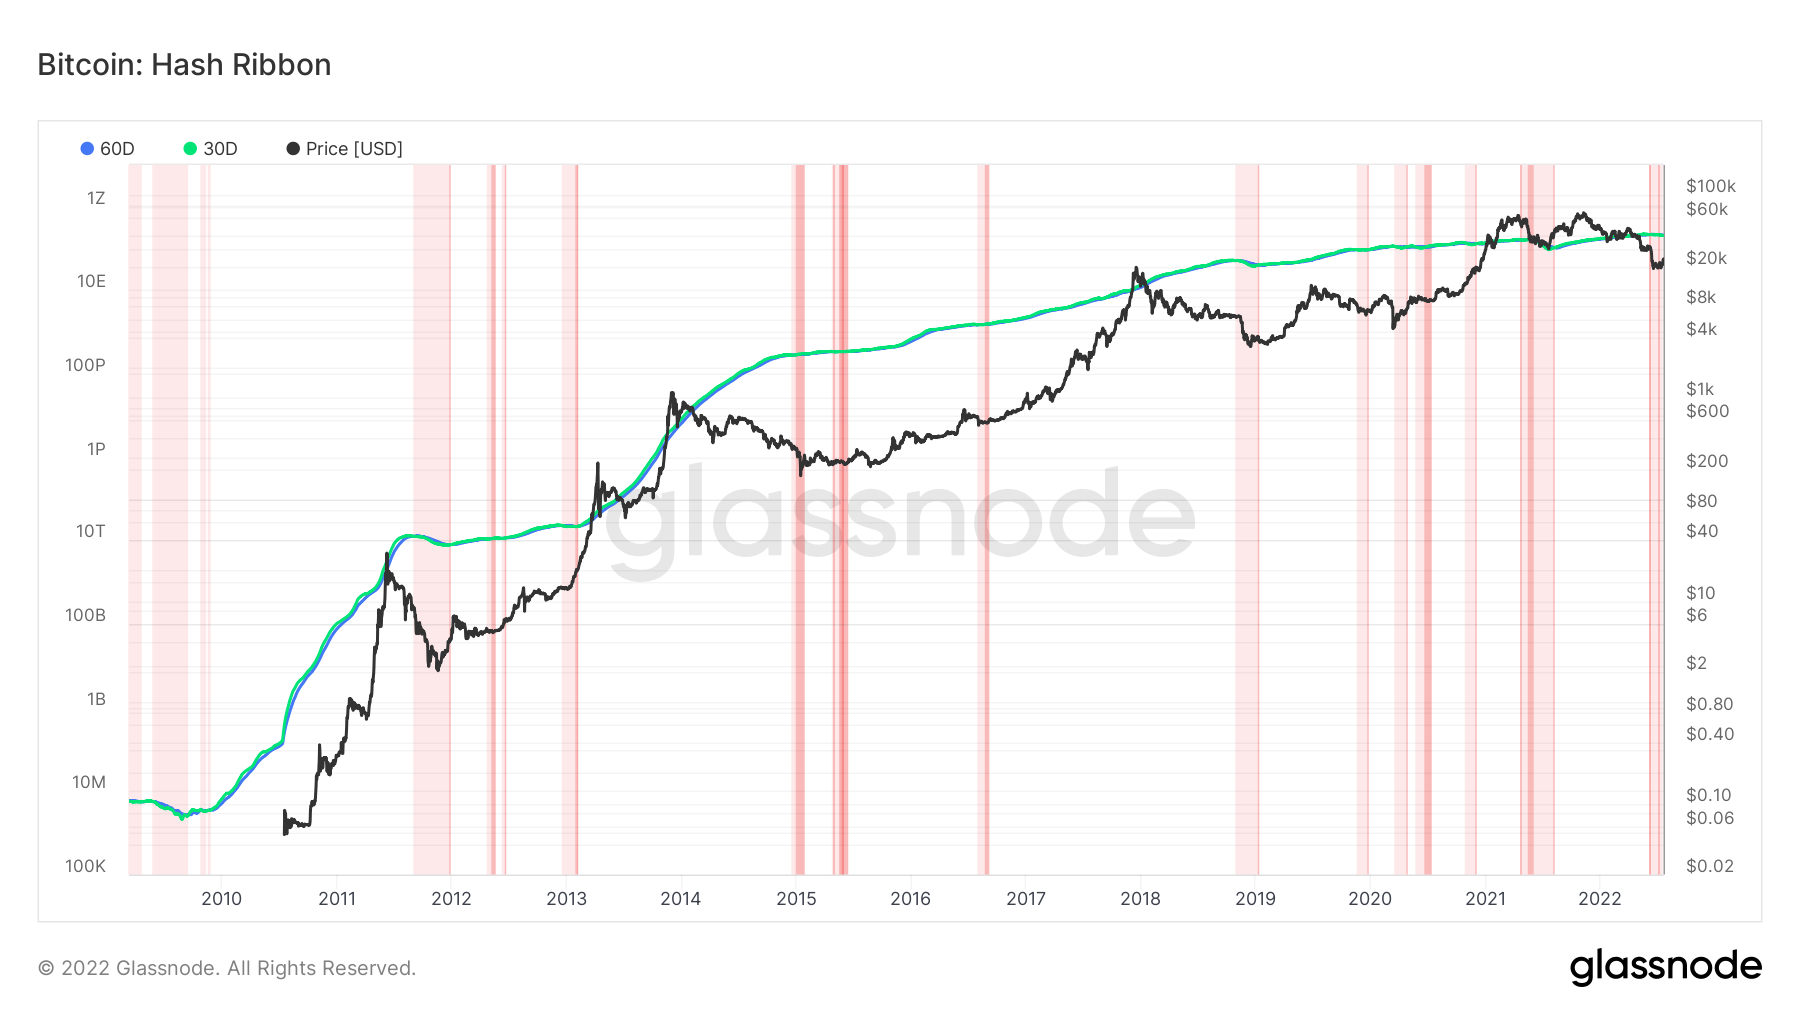
Hash Ribbon Chart By Glassnode
A closer look at the movement shows that a bearish cross occurred on June 7. So, a cross has been in place for 42 days. The current price bottom was made 11 days after the cross, more specifically on June 18.
In 2015 (black circle), the cross was in place for 40 days. However, the bottom was reached 25 days after the cross.
In 2018 (blue circle), the cross was in place for 61 days. However, the bottom was reached after 45 days.
Finally, in March 2020 (yellow), the cross was in place for 36 days. Interestingly, the bottom was reached five days prior to the cross.
So, when using this data for the current movement, it is possible that the cross will continue to be in place for at roughly 20 more days, but it is possible that a bottom has been already reached.
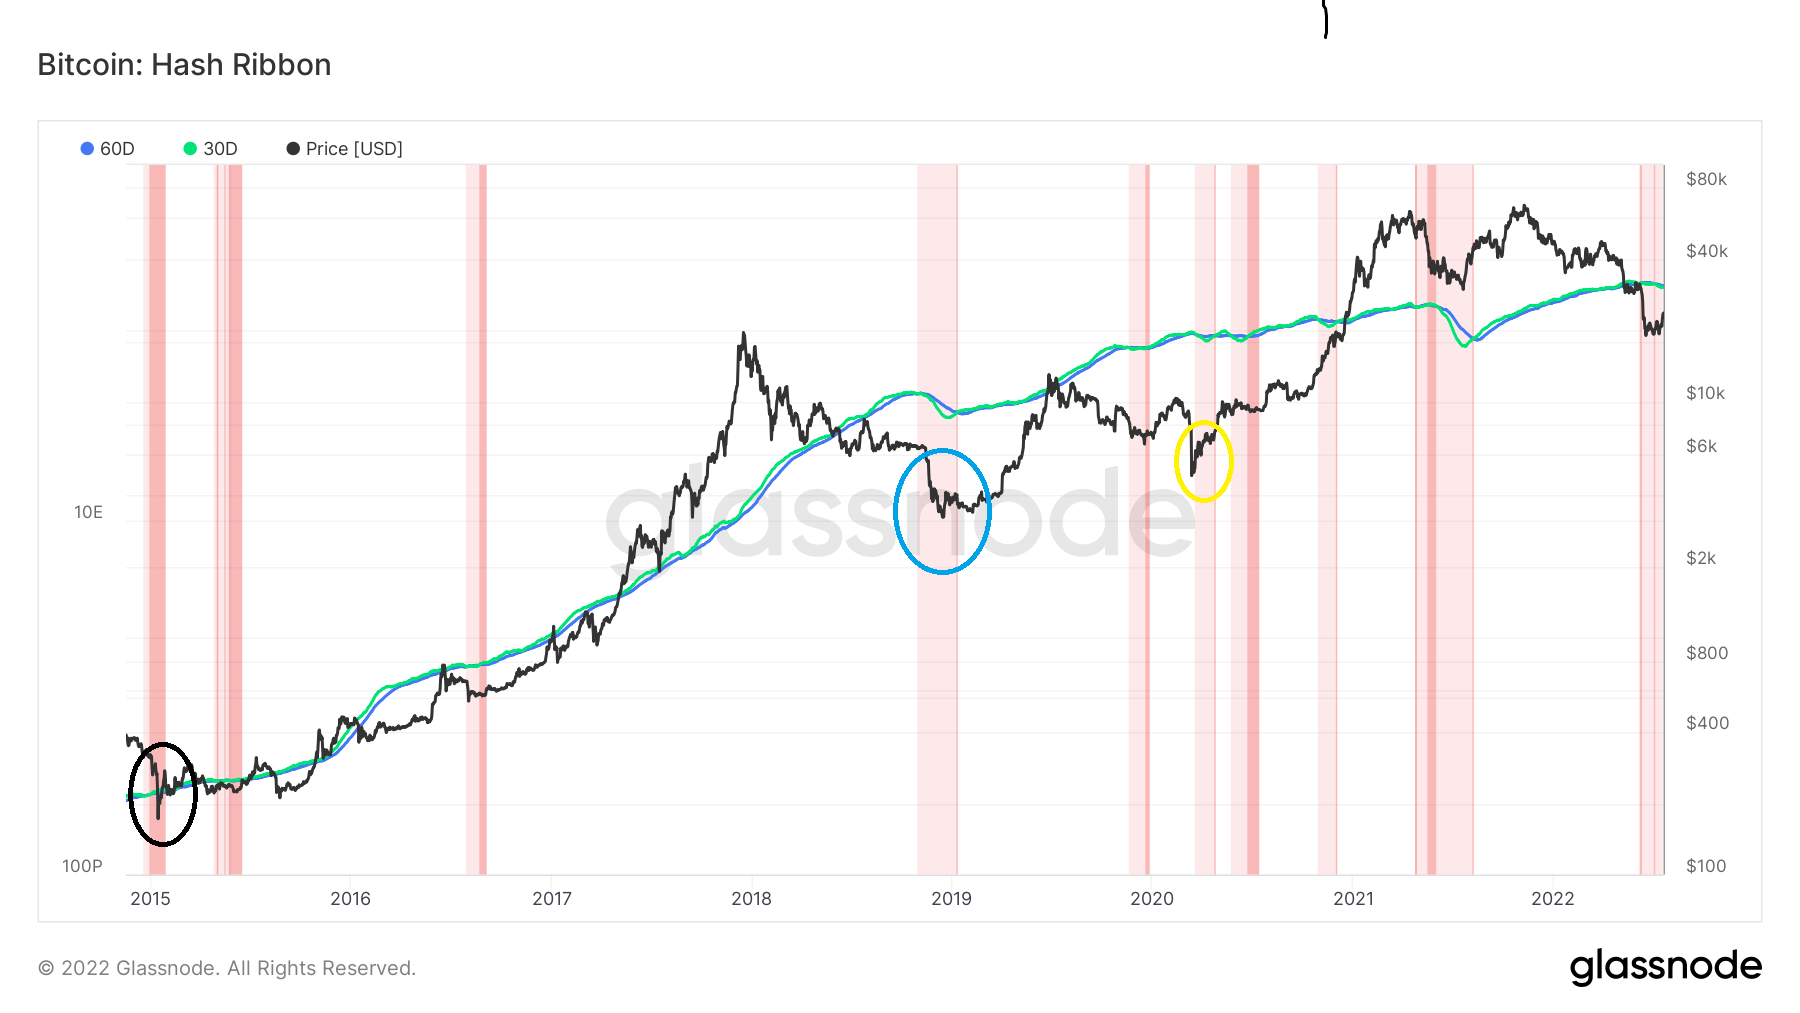
Hash Ribbon Chart by Glassnode
For Be[in]Crypto’s latest Bitcoin (BTC) analysis,click here


 Bitcoin
  Ethereum
  Tether
  USDC
USDC  Dogecoin
  Cardano
  Bitcoin Cash
  Polygon
  Litecoin
  LEO Token
  OKB
OKB  Cosmos Hub
  Stellar
  Hedera
  Maker
Maker  Algorand
  NEO
NEO  Synthetix Network
  Gate
Gate  KuCoin
  IOTA
IOTA  Tether Gold
  TrueUSD
  Enjin Coin
  0x Protocol
  Ravencoin
  Holo
Holo  Siacoin
  Basic Attention
  Ontology
  Zcash
Zcash  Decred
  Lisk
Lisk  Waves
Waves  DigiByte
  Numeraire
  Status
  Pax Dollar
  Nano
Nano  Steem
Steem  OMG Network
  BUSD
BUSD  Ren
Ren  Bitcoin Diamond
  Bytom
Bytom  HUSD
HUSD  Energi
  Augur
Augur