


Bitcoin (BTC) Reaches Weekly Close Above $20,000 Despite Some Weekend Weakness

Bitcoin (BTC) is showing signs of a potential local bottom due to bullish readings in the weekly and daily time frames.
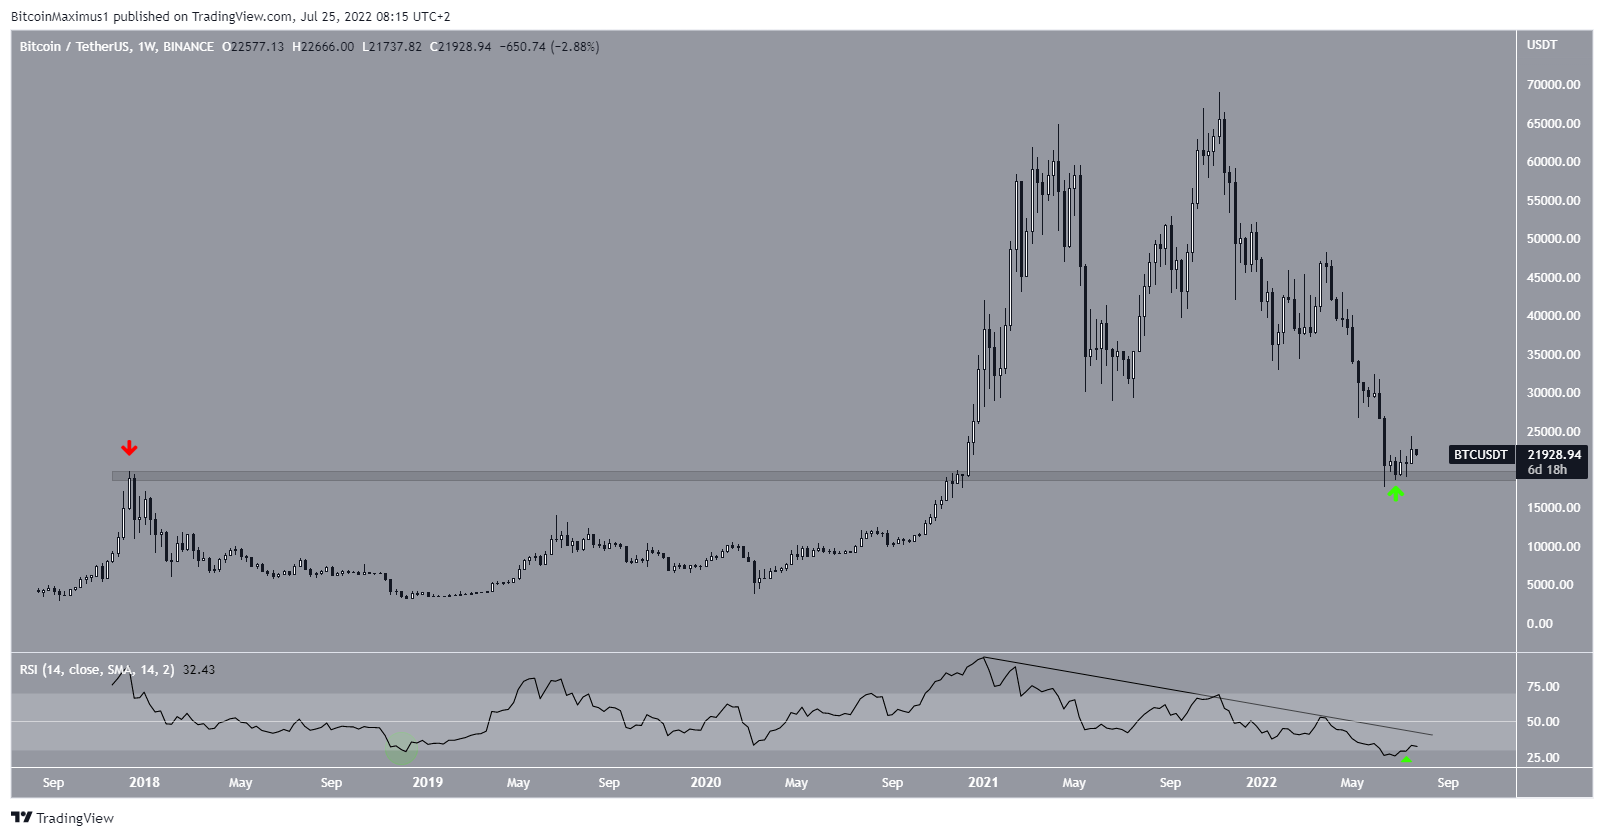
The Bitcoin price movement during the week of July 17-24 was notably bullish. BTC reached a high of $24,276, but after a retracement reached a close of $22,600, which was still roughly $2,000 above the opening price.
The indicator readings are also bullish because the RSI has moved outside of its oversold territory (green icon). At the end of 2018, a similar movement (green circle) was the catalyst for the beginning of a long-term bullish rally.
If the RSI were to break out above its descending trendline (black) and move above 50, it would confirm that the trend is bullish.
Additionally, the price has bounced at the $19,250 horizontal support area (green arrow), a level that acted as the all-time high resistance in 2017 (red arrow).
BTC/USDT Chart By TradingView
BTC breaks out
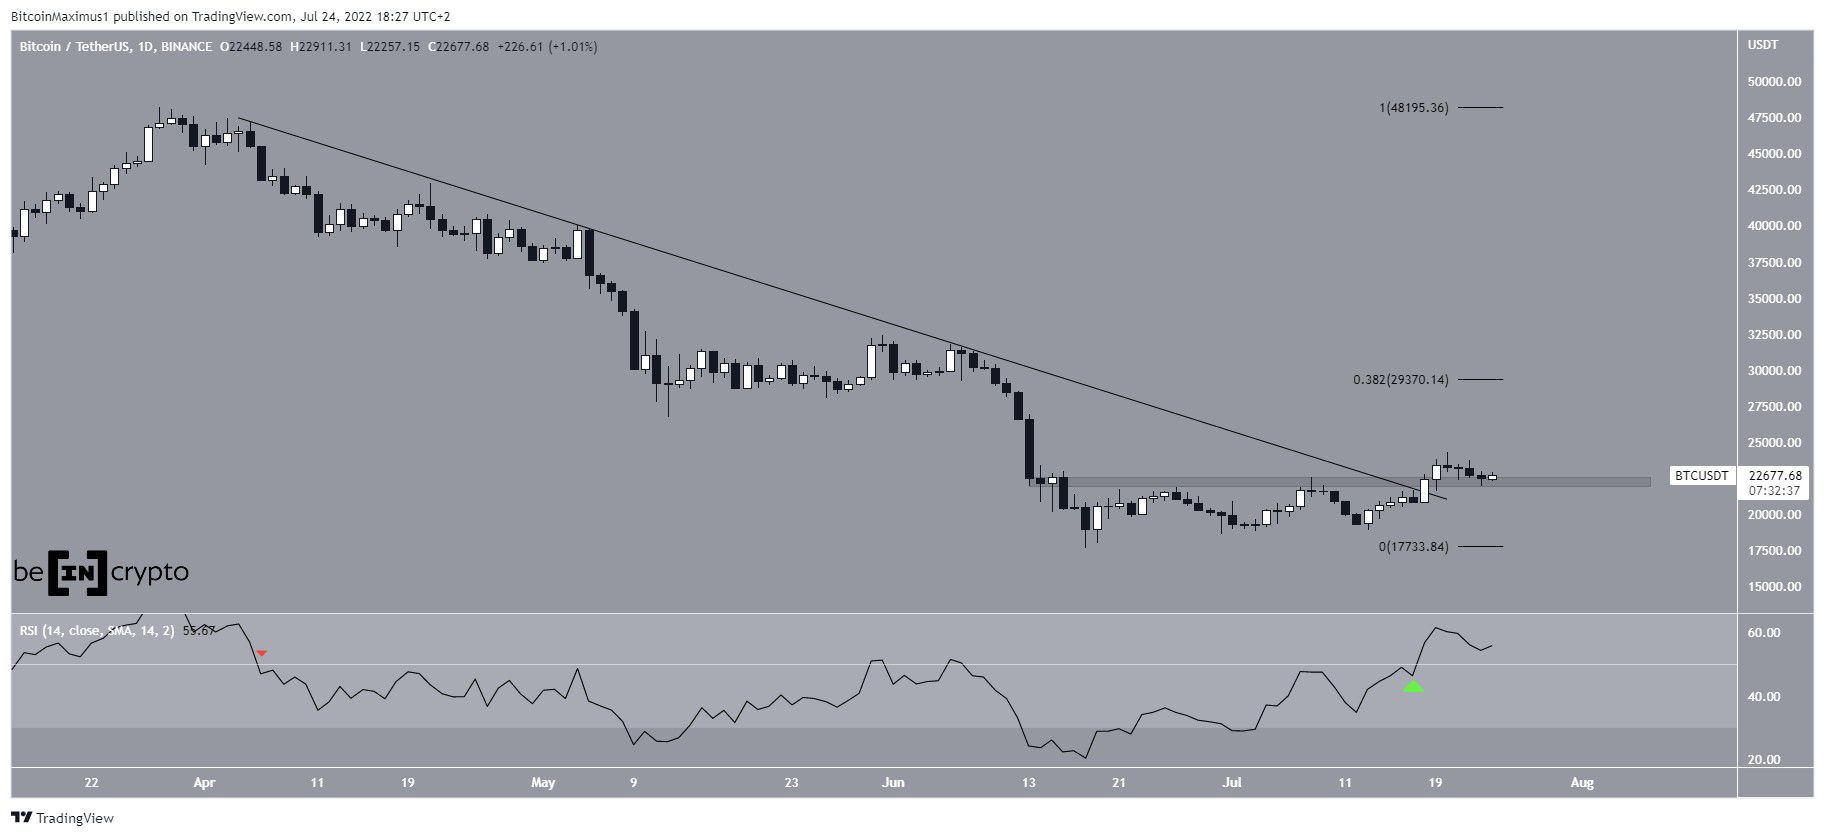
The daily chart paints a mostly bullish picture.
Firstly, the price has broken out from a descending resistance line that had been in place since April 5. Breakouts from such long-term structures usually lead to significant upward moves.
Secondly, Bitcoin has also moved above the $22,300 horizontal area and validated it as support. So, the price has broken out from both a diagonal and a horizontal resistance level.
Finally, the daily RSI has increased above 50 (green icon), a movement that is associated with bullish trends. The previous time this indicator crossed below 50 (red icon) was on April 6. Thus, the indicator was below 50 for the entirety of the descending resistance line and crossed above 50 once the price broke out, further increasing its validity.
If the upward trend continues, the closest resistance area would likely be reached be at $29,370. This is the 0.382 Fib retracement resistance level.
BTC/USDT Chart By TradingView
Future movement
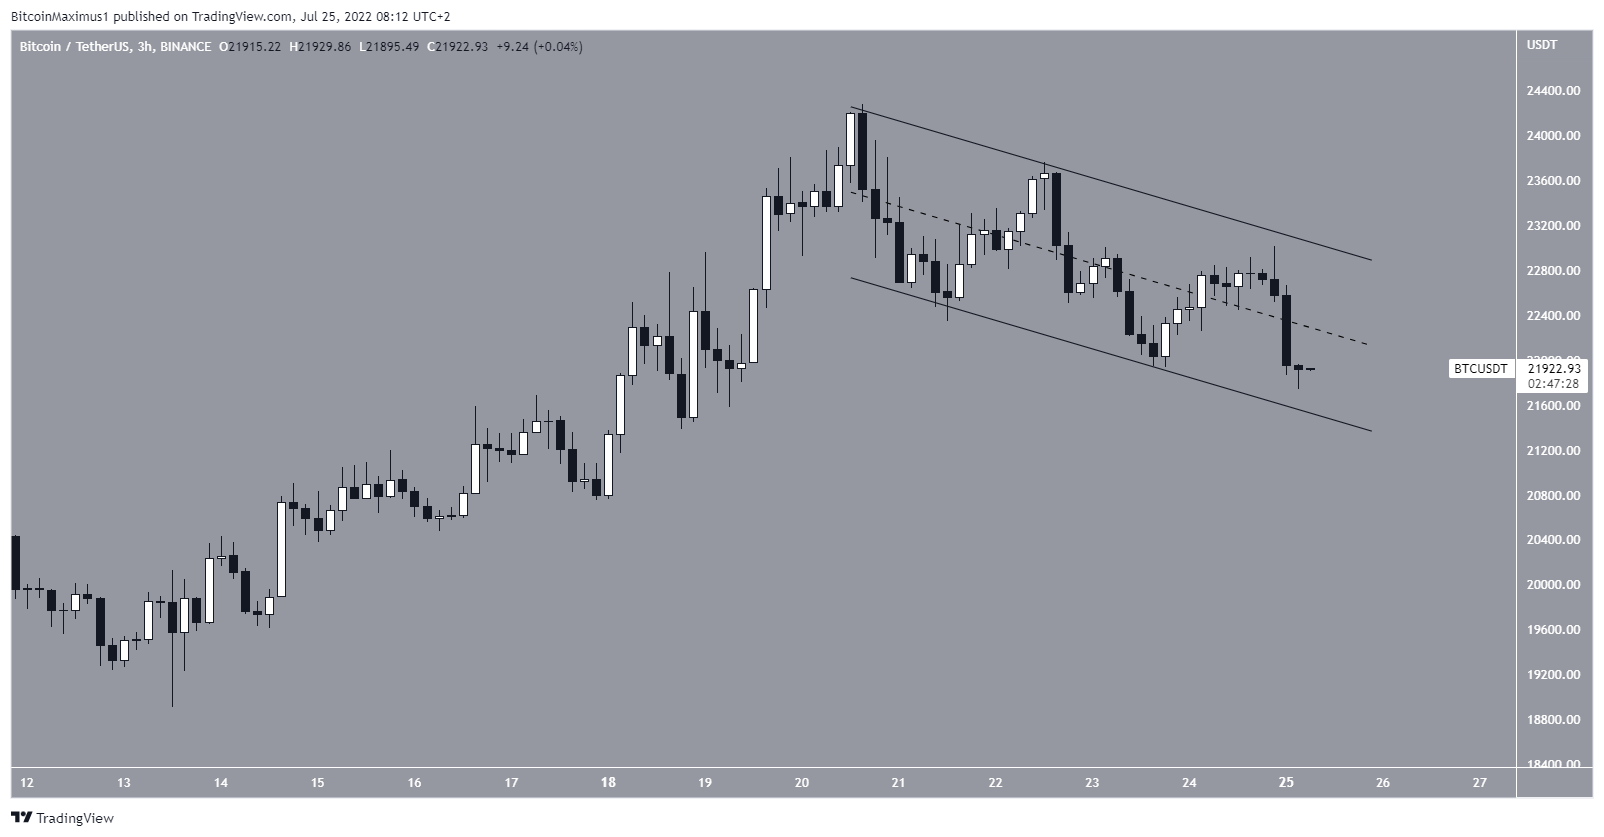
The three-hour chart shows that Bitcoin has been trading inside a descending parallel channel since its July 21 high. Such channels usually contain corrective structures, meaning that an eventual breakout from it would be expected.
Moreover, there is considerable overlap inside the channel, suggesting that the decrease is corrective.
So, a breakout from the channel seems to be the most likely scenario.
BTC/USDT Chart By TradingView
For Be[in]Crypto’s previous bitcoin (BTC) analysis, click here


 Bitcoin
  Ethereum
  Tether
  USDC
USDC  Dogecoin
  Cardano
  Bitcoin Cash
  Polygon
  Litecoin
  LEO Token
  Hedera
  Stellar
  Cosmos Hub
  OKB
OKB  Maker
Maker  Algorand
  NEO
NEO  Gate
Gate  KuCoin
  Synthetix Network
  IOTA
IOTA  Tether Gold
  TrueUSD
  Enjin Coin
  Ravencoin
  Holo
Holo  0x Protocol
  Siacoin
  Basic Attention
  Ontology
  Decred
  Zcash
Zcash  Waves
Waves  Lisk
Lisk  DigiByte
  Numeraire
  Status
  Nano
Nano  Pax Dollar
  Steem
Steem  OMG Network
  BUSD
BUSD  Ren
Ren  Bytom
Bytom  Bitcoin Diamond
  HUSD
HUSD  Energi
  Augur
Augur