


Bitcoin (BTC) to USDT chart over the 1 hour timeframe…
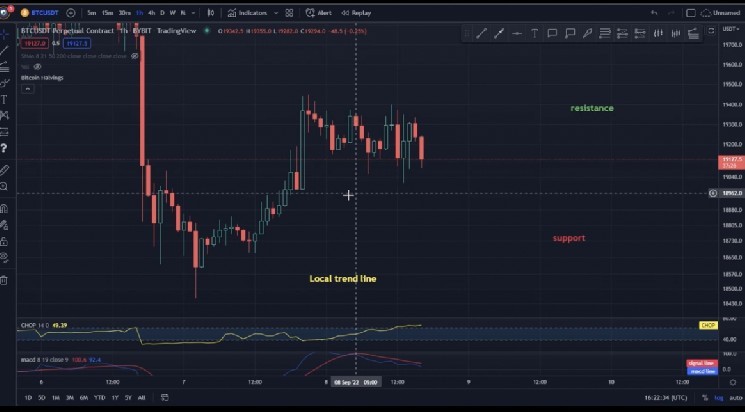
Hello everyone, let’s take a look at the BTC to USDT chart over the 1 hour timeframe on 08.09.2022. As you can see, the price is moving below the local uptrend line.
Let’s start with the designation of the support line and as you can see the first support in the near future is $ 19,090, if the support breaks down, the next support is $ 19,022, $ 18,942 and $ 18,692.
Now let’s move from the resistance line, as you can see, the first resistance is $ 19,247, if you can break it, the next resistance will be $ 19393, $ 19509 and $ 19625
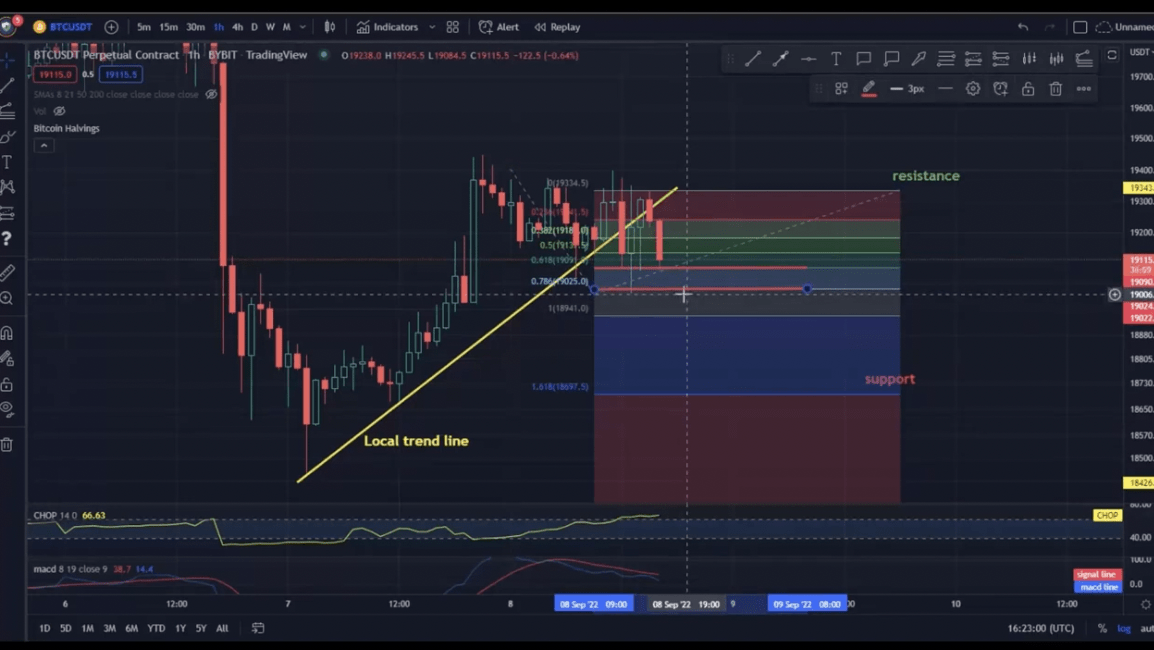
Looking at the CHOP indicator, we can see that we have a lot of energy in the 1-hour interval, and the MACD indicator shows a local downward trend.
Disclaimer: Technical Analysis is provided by a third party, and for informational purposes only. It does not reflect the views of Crypto Daily, nor is it intended to be used as legal, tax, investment, or financial advice.


 Bitcoin
  Ethereum
  Tether
  USDC
USDC  Dogecoin
  Cardano
  Bitcoin Cash
  Polygon
  Litecoin
  LEO Token
  Cosmos Hub
  Stellar
  OKB
OKB  Hedera
  Maker
Maker  Algorand
  NEO
NEO  Synthetix Network
  Gate
Gate  KuCoin
  IOTA
IOTA  Tether Gold
  TrueUSD
  Enjin Coin
  0x Protocol
  Holo
Holo  Ravencoin
  Siacoin
  Ontology
  Basic Attention
  Decred
  Zcash
Zcash  Lisk
Lisk  Waves
Waves  DigiByte
  Numeraire
  Status
  Nano
Nano  Pax Dollar
  Steem
Steem  OMG Network
  BUSD
BUSD  Ren
Ren  Bytom
Bytom  Bitcoin Diamond
  HUSD
HUSD  Energi
  Augur
Augur