


Bitcoin price analysis: BTC ready for big short as bulls knock on $25k

Bitcoin price analysis shows that the pair is readying for its next turn of events which can either be extremely bullish or bearish. As the BTC/USD pair touches $24,900 barrier, the bulls are elated for higher levels and the bears are busy preparing for the next onslaught. The major cryptocurrency is ripe for its next big move.
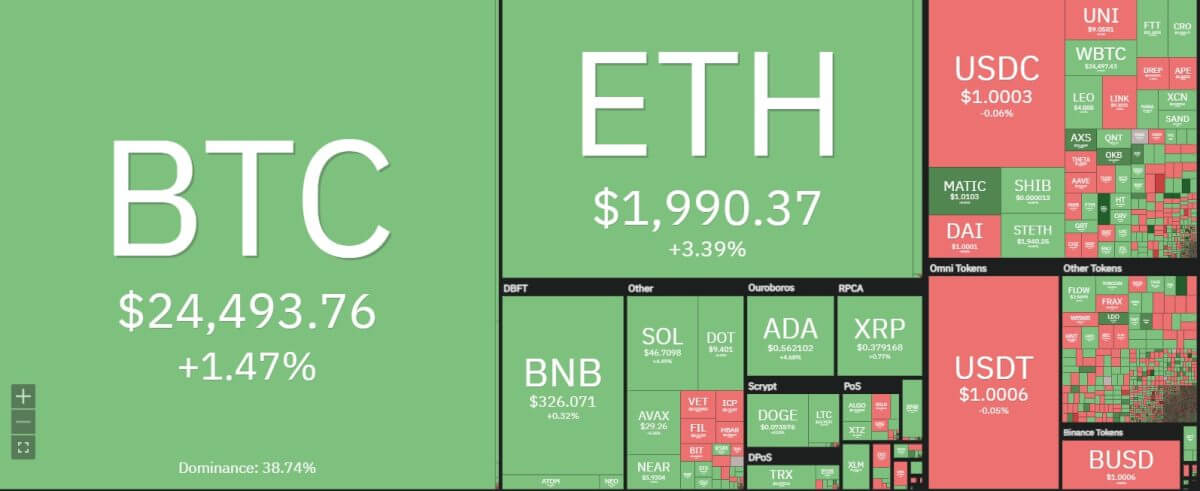
Source: Coin360
The BTC/USD pair is nearing rejection zone and the psychological level of $25,000 where the bulls will face the eventual double top pattern. The buyers are surely trying to maintain the momentum going higher and the 20-day exponential moving average is putting the pressure on the bulls. The widening Bollinger Bands is also hinting at upcoming volatility in the pair.
Bitcoin price movement in the last 24 hours: Two consecutive days of higher highs
Bitcoin price analysis shows that the pair has posted two consecutive days of higher price pattern. Currently, the pair is trading at $24,480 and is comfortable above the $24k barrier where the higher daily candlestick will also support the price. The dwindling volume data suggests that bulls are losing the momentum through the weekend.
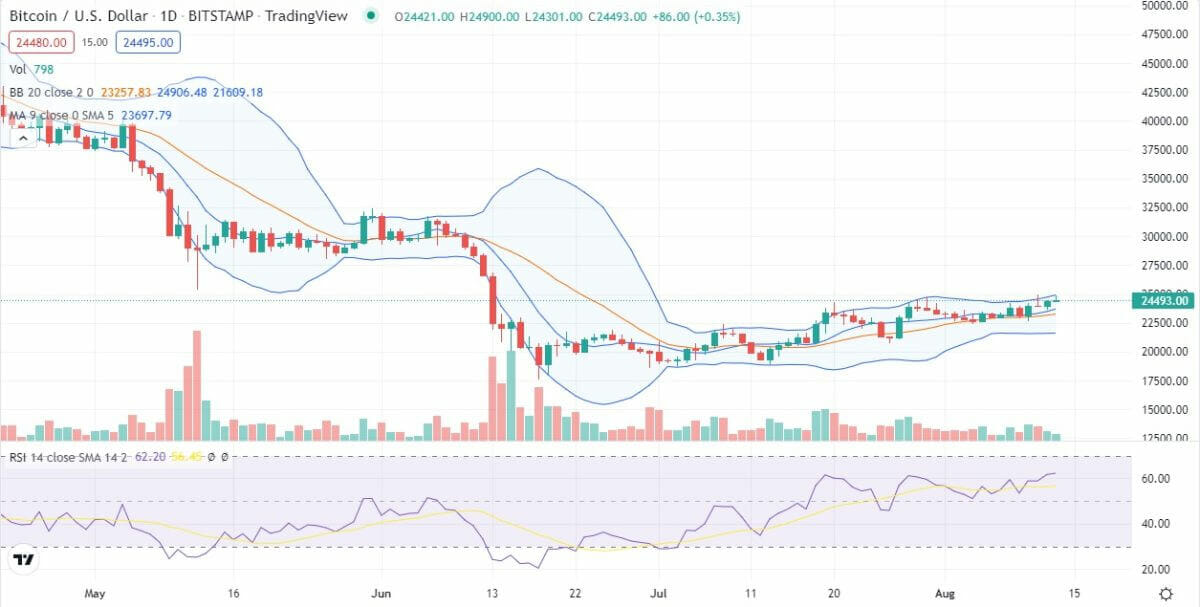
Source: TradingView
The upside momentum may turn weaker as the weekend dust settles down amid low liquidity as per Bitcoin price analysis. The daily chart reflects that there is a ‘Cup & Handle’ pattern formation in the bullish territory which can ignite further gains in the pair. However, onward journey demands massive volumes since the BTC/USD pair faces stiff resistance from the bears near $25k barrier. Bitcoin price analysis shows that the swing high at $24,900 is complete and bulls need to strengthen their resolve to move higher price levels.
BTC/USD 4-hour chart: Will double top pattern result in a pullback?
The emergence of the double top pattern in the BTC/USD pair is what is causing concern among the bulls. The low volatility on the weekend coupled with minimal volumes can make matters worse for the king of cryptocurrencies. The immediate price pullback from $24,900 can be due to this pattern formation. The pair fell towards $24,350 support zone on the hourly charts.
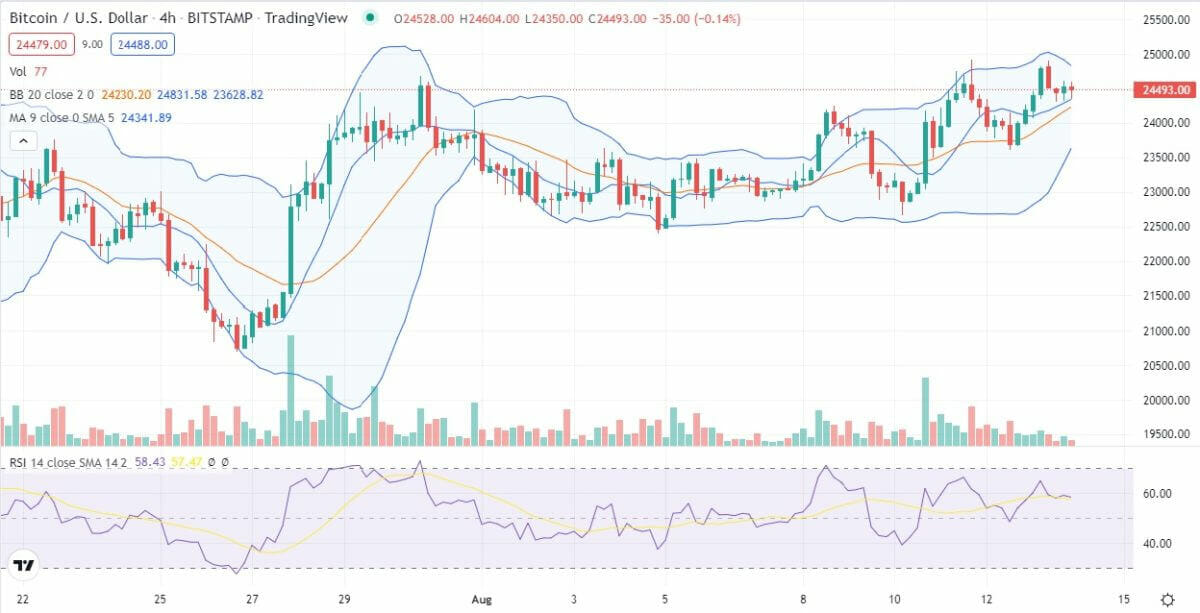
Source: TradingView
The additional buying can take the pair towards $25,000 resistance zone where it can once again encounter the same repulsive force. The MACD indictor shows a bullish crossover and it can trigger a short-term buying spree. If challenged, the price can fall towards the 20-day moving average and even decline to $23,700 level over the weekend.
Bitcoin price analysis conclusion: Broadening pattern may hint at higher prices
The upper boundary of the bearish flag pattern has been breached by the BTC/USD pair. The rejection from upper limits at $25,000 shows that the short-term outlook can turn bearish. The RSI oscillator shows a higher tick on the hourly charts. Such confluence of the signals can mean diverging price patterns as per Bitcoin price analysis.
An extreme case of price correction can take the BTC/USD pair towards $21,000 support. However, it seems highly unlikely considering the higher uptick on the hourly charts.
Disclaimer. The information provided is not trading advice. Cryptopolitan.com holds no liability for any investments made based on the information provided on this page. We strongly recommend independent research and/or consultation with a qualified professional before making any investment decisions.


 Bitcoin
  Ethereum
  Tether
  USDC
USDC  Dogecoin
  Cardano
  Bitcoin Cash
  Polygon
  Litecoin
  Hedera
  LEO Token
  Stellar
  Cosmos Hub
  OKB
OKB  Maker
Maker  Algorand
  NEO
NEO  Gate
Gate  Synthetix Network
  KuCoin
  IOTA
IOTA  Tether Gold
  TrueUSD
  Enjin Coin
  Holo
Holo  0x Protocol
  Ravencoin
  Siacoin
  Basic Attention
  Ontology
  Decred
  Zcash
Zcash  Waves
Waves  Lisk
Lisk  DigiByte
  Status
  Numeraire
  Nano
Nano  Steem
Steem  Pax Dollar
  OMG Network
  BUSD
BUSD  Ren
Ren  Bytom
Bytom  Bitcoin Diamond
  HUSD
HUSD  Energi
  Augur
Augur