


Bitcoin Price Analysis: Rangebound Near 20103 — 3 September 2022
BTC/USD Rangebound Around 20103: Sally Ho’s Technical Analysis – 3 September 2022
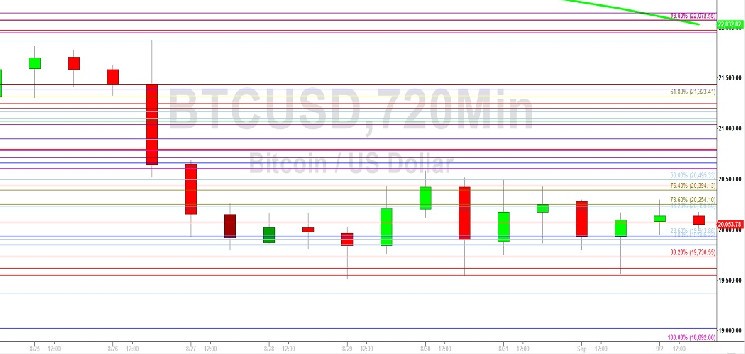
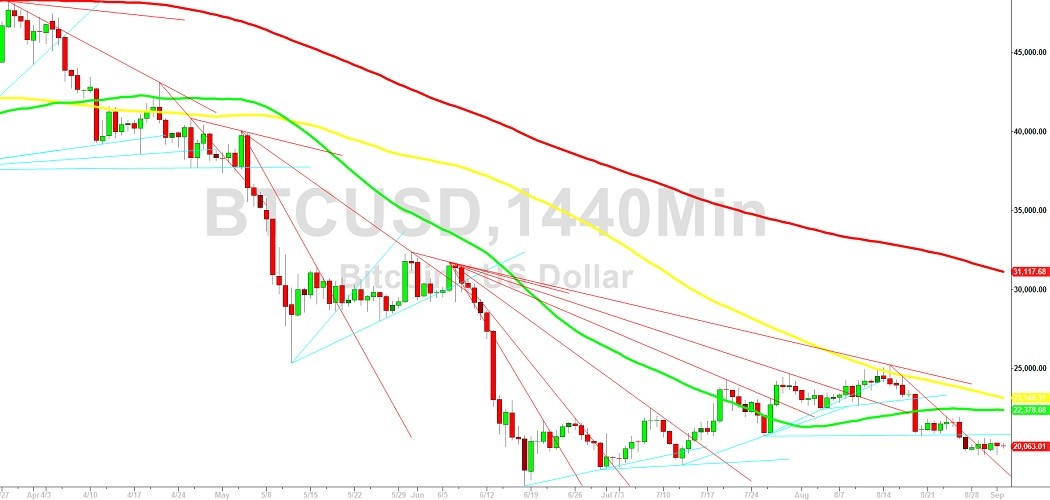
Bitcoin (BTC/USD) remained in a tight range early in the Asian session as the pair continued to orbit the 20103.76 area, representing the 23.6% retracement of the depreciating range from 28314.52 to 17567.45. A series of recent lower highs and a weakening technical environment suggest BTC/USD may experience additional short-term weakness following its 18% decline in August and ongoing 81% year-to-date pullback in 2022. Traders were unable to get BTC/USD to sustain a short-lived break above the 24558.33 level during the month of August, an area that represents the 50% of the depreciating range from 31549.21 to 17567.45. Following the recent selling pressure, additional significant technical areas on the downside include the 16990.14, 14500.15, and 10432.73 areas.
Following stronger episodes of downside pressure, areas of technical resistance and potential selling pressure include the 20619, 20782, 20839, 20887, 21077, 21095, 21387, and 21575 areas. Above recent price activity, upside retracement levels in the depreciating range from 31549.21 to 17567.45 include the 26208, 28249, and 28557 areas. Additional upside price objectives and areas of potential selling pressure include the 25552, 26323, 26411, 26901, 27126, 27455, 28426, and 29669 areas. Traders are observing that the 50-bar MA (4-hourly) is bearishly indicating below the 100-bar MA (4-hourly) and below the 200-bar MA (4-hourly). Also, the 50-bar MA (hourly) is bearishly indicating below the 100-bar MA (hourly) and below the 200-bar MA (hourly).
Price activity is nearest the 50-bar MA (4-hourly) at 20338.21 and the 100-bar MA (Hourly) at 20048.43.
Technical Support is expected around 16990.14/ 14500.15/ 10432.73 with Stops expected below.
Technical Resistance is expected around 25256.96/ 27455.20/ 32383.96 with Stops expected above.
On 4-Hourly chart, SlowK is Bearishly below SlowD while MACD is Bullishly above MACDAverage.
On 60-minute chart, SlowK is Bearishly below SlowD while MACD is Bearishly below MACDAverage.
Disclaimer: Sally Ho’s Technical Analysis is provided by a third party, and for informational purposes only. It does not reflect the views of Crypto Daily, nor is it intended to be used as legal, tax, investment, or financial advice.


 Bitcoin
  Ethereum
  Tether
  USDC
USDC  Dogecoin
  Cardano
  Bitcoin Cash
  Polygon
  Litecoin
  LEO Token
  Hedera
  Stellar
  Cosmos Hub
  OKB
OKB  Maker
Maker  Algorand
  NEO
NEO  Gate
Gate  KuCoin
  Synthetix Network
  IOTA
IOTA  Tether Gold
  TrueUSD
  Enjin Coin
  Holo
Holo  Ravencoin
  0x Protocol
  Siacoin
  Basic Attention
  Ontology
  Decred
  Zcash
Zcash  Waves
Waves  Lisk
Lisk  DigiByte
  Numeraire
  Status
  Nano
Nano  Pax Dollar
  Steem
Steem  OMG Network
  BUSD
BUSD  Ren
Ren  Bytom
Bytom  Bitcoin Diamond
  HUSD
HUSD  Energi
  Augur
Augur