


Bitcoin Price Dips As Dollar Rips, Key Support Nearby

Bitcoin price is correcting gains below the $23,250 zone. BTC must stay above the $22,500 support to avoid a major drop in the coming sessions.
- Bitcoin is correcting gains below the $23,250 support zone.
- The price is trading below $23,250 and the 100 hourly simple moving average.
- There was a break below a key bullish trend line with support near $23,380 on the hourly chart of the BTC/USD pair (data feed from Kraken).
- The pair could continue lower towards the $22,500 support zone in the near term.
Bitcoin Price Remains Supported
Bitcoin price failed to settle above the $24,000 level and started a downside correction. BTC declined below the $23,500 and $23,250 support levels to move into a short-term bearish zone.
There was a break below a key bullish trend line with support near $23,380 on the hourly chart of the BTC/USD pair. The pair even declined below the $23,000 level. A low is formed near $22,758 and the price is now consolidating losses.
Bitcoin price is trading below $23,250 and the 100 hourly simple moving average. An immediate resistance is near the $23,000 zone. It is near the 23.6% Fib retracement level of the recent decline from the $23,589 swing high to $22,758 low.
The next major resistance is near the $23,200 zone. There is also a connecting bearish trend line with resistance near $23,200 on the same chart. The trend line is close to the 50% Fib retracement level of the recent decline from the $23,589 swing high to $22,758 low.
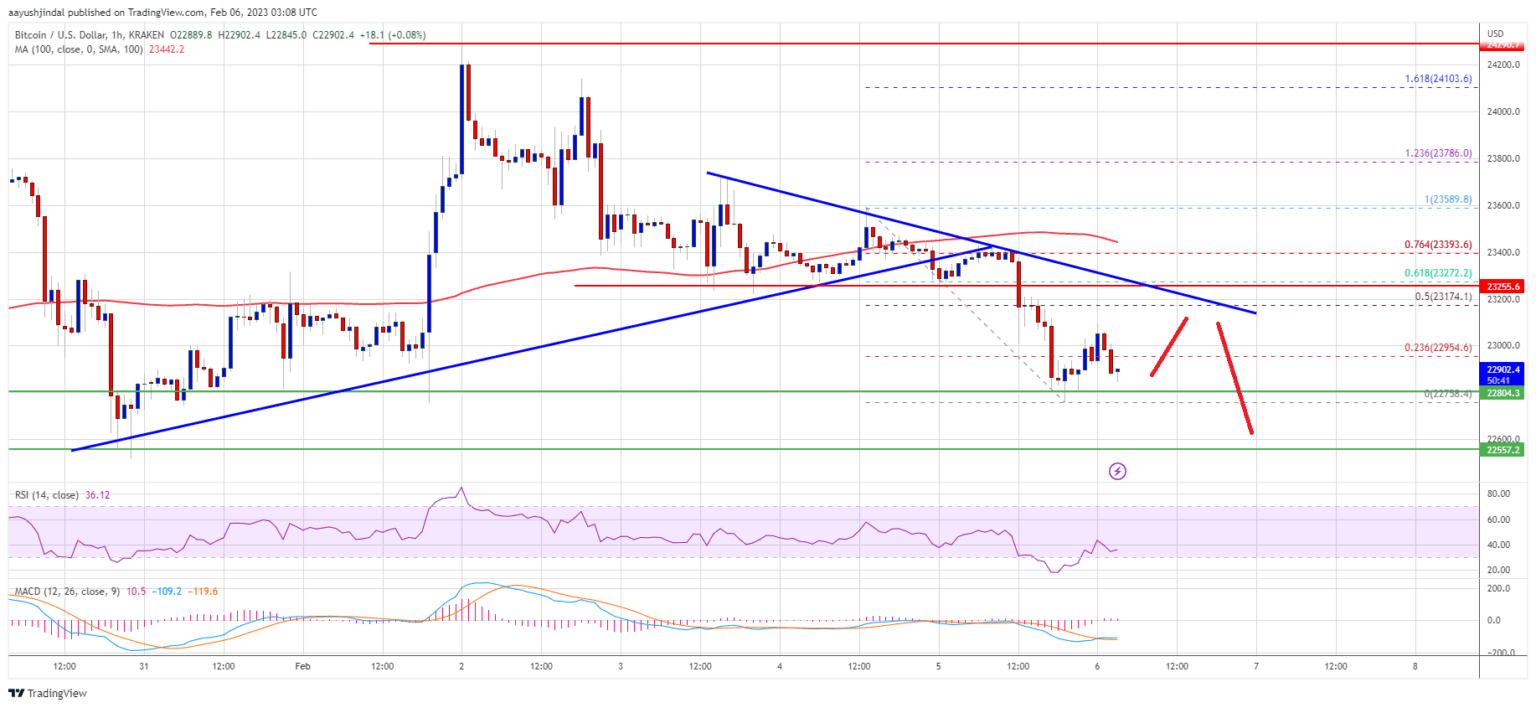
Source: BTCUSD on TradingView.com
A clear move above the $23,200 resistance might start a decent increase. In the stated case, the price may perhaps rise towards the $23,500 level. The next resistance could be near the $24,250 level, above which btc price might test $25,000.
More Losses in BTC?
If bitcoin price fails to clear the $23,200 resistance, it could continue to move down. An immediate support on the downside is near the $22,750 zone.
The next major support is near the $22,550 zone. A downside break below the $22,500 level might send the price towards the $22,200 level. Any more losses might send the price to $21,500 in the near term.
Technical indicators:
Hourly MACD – The MACD is now losing pace in the bearish zone.
Hourly RSI (Relative Strength Index) – The RSI for BTC/USD is now below the 50 level.
Major Support Levels – $22,750, followed by $22,550.
Major Resistance Levels – $23,000, $23,200 and $23,500.


 Bitcoin
  Ethereum
  Tether
  USDC
USDC  Dogecoin
  Cardano
  Bitcoin Cash
  Polygon
  Litecoin
  LEO Token
  Hedera
  Stellar
  Cosmos Hub
  OKB
OKB  Maker
Maker  Algorand
  NEO
NEO  Gate
Gate  KuCoin
  Synthetix Network
  IOTA
IOTA  Tether Gold
  TrueUSD
  Enjin Coin
  Holo
Holo  Ravencoin
  Siacoin
  0x Protocol
  Basic Attention
  Ontology
  Decred
  Zcash
Zcash  Lisk
Lisk  Waves
Waves  DigiByte
  Numeraire
  Status
  Nano
Nano  Pax Dollar
  Steem
Steem  OMG Network
  BUSD
BUSD  Ren
Ren  Bytom
Bytom  Bitcoin Diamond
  HUSD
HUSD  Energi
  Augur
Augur