


BTC Hanging By a Thread but is $17K in Play? (Bitcoin Price Analysis)
It’s been over 9 months since Bitcoin’s all-time high at $69K in November 2021. The cryptocurrency continues its gruesome downtrend and has yet to show any signs of recovery. The market is currently quiet, but next week’s price action could be key to determining the mid-term future.
Technical Analysis
By: Edris
The Daily Chart
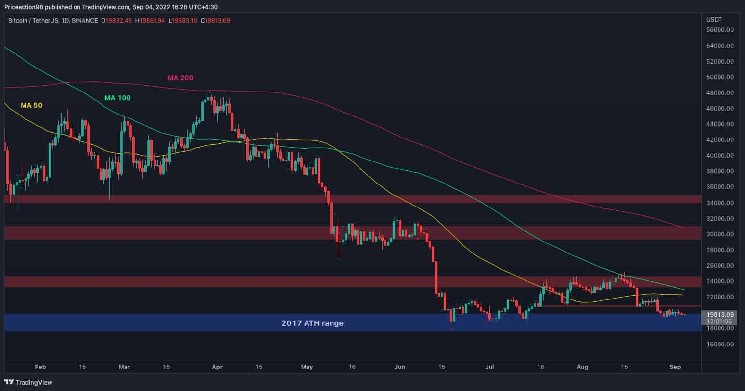
Looking at the daily chart, the price has been consolidating in a tight range between $19,500 and $20,500 over the past few days, showing little intent for a significant move in any direction. The $20K support area seems to be holding the price for now.
If a bullish rebound is to happen, the 50-day and 100-day moving average lines around $23K and the $24K resistance level would be key areas to watch for as they can initiate a bearish continuation.
On the other hand, a breakdown from the $17K-$20K area could prove disastrous for the market, as, in this case, a rapid decline towards $15K and beyond would be probable. This would prolong the bear market significantly as bottom formation and accumulations take months at the end stage of bear markets.

The 4-Hour Chart
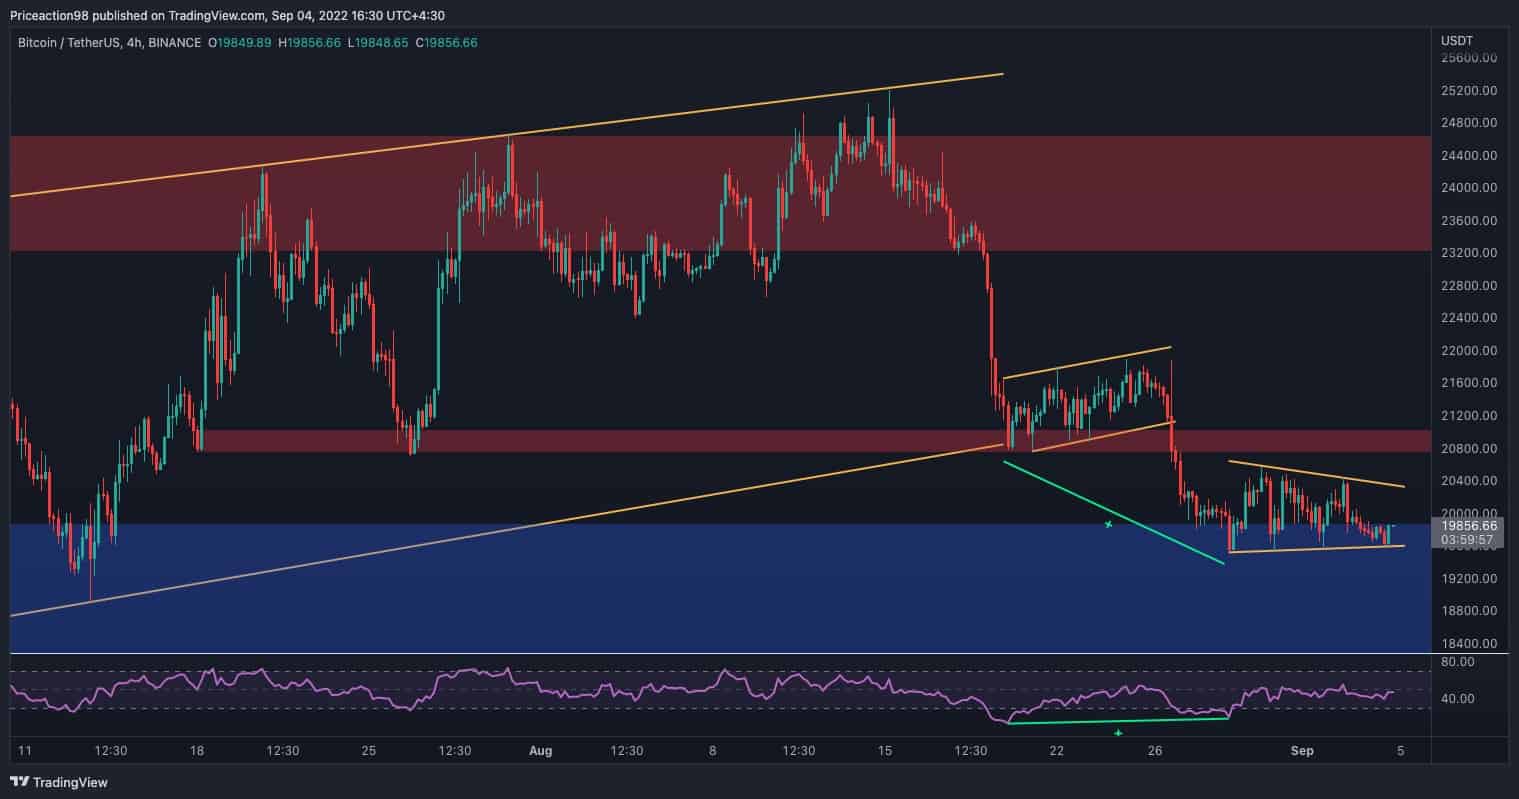
On the 4-hour timeframe, the price is oscillating in a symmetrical triangle pattern after breaking below the large bearish flag and falling under the $21K level. A retest of the $21K level could be anticipated in the short-term as the price has already been rejected from the $20K support area several times.
However, it would not be likely for the market to break above the $21K level as the current price action is suggesting a consolidation before a further bearish continuation below the $20K support level.
The RSI is also near the 50% level after printing a bullish divergence a few days ago, suggesting that neither the bulls nor the bears are in full control, and the momentum is presently neutral.


 Bitcoin
  Ethereum
  Tether
  USDC
USDC  Dogecoin
  Cardano
  Bitcoin Cash
  Polygon
  Litecoin
  LEO Token
  OKB
OKB  Cosmos Hub
  Stellar
  Hedera
  Maker
Maker  Algorand
  NEO
NEO  Synthetix Network
  Gate
Gate  KuCoin
  IOTA
IOTA  Tether Gold
  TrueUSD
  Enjin Coin
  0x Protocol
  Ravencoin
  Holo
Holo  Siacoin
  Basic Attention
  Decred
  Zcash
Zcash  Ontology
  Waves
Waves  Lisk
Lisk  DigiByte
  Numeraire
  Status
  Nano
Nano  Pax Dollar
  Steem
Steem  OMG Network
  BUSD
BUSD  Ren
Ren  Bitcoin Diamond
  Bytom
Bytom  HUSD
HUSD  Energi
  Augur
Augur