


BTC Technical Analysis: Will Bitcoin Tank Under $20,000 This Week?

The BTC price action shows a relief rally over the weekend, but the lack of bullish momentum threatens a downtrend breaking under $20,000.
Key Technical Points:
- The Bitcoin (BTC) market price dropped by 12% last week.
- The 3% bullish recovery over the weekend retests the bearish breakout of $21,875.
- With a market cap of $410 billion, the intraday trading volume of Bitcoin has decreased by 10% to reach $22.94 billion.
Past Performance of BTC
The Bitcoin (BTC) price action shows a bullish failure to rise above the $25,335 level and the 100-day EMA due to the increased supply pressure. The correction phase breaks below the 50-day EMA and the long-coming support trendline, accounting for a 12% price drop last week. Moreover, the Bitcoin market price tanks below the $25,000 mark and retests it over the weekend with a 3% recovery with minimal intraday trading volume.
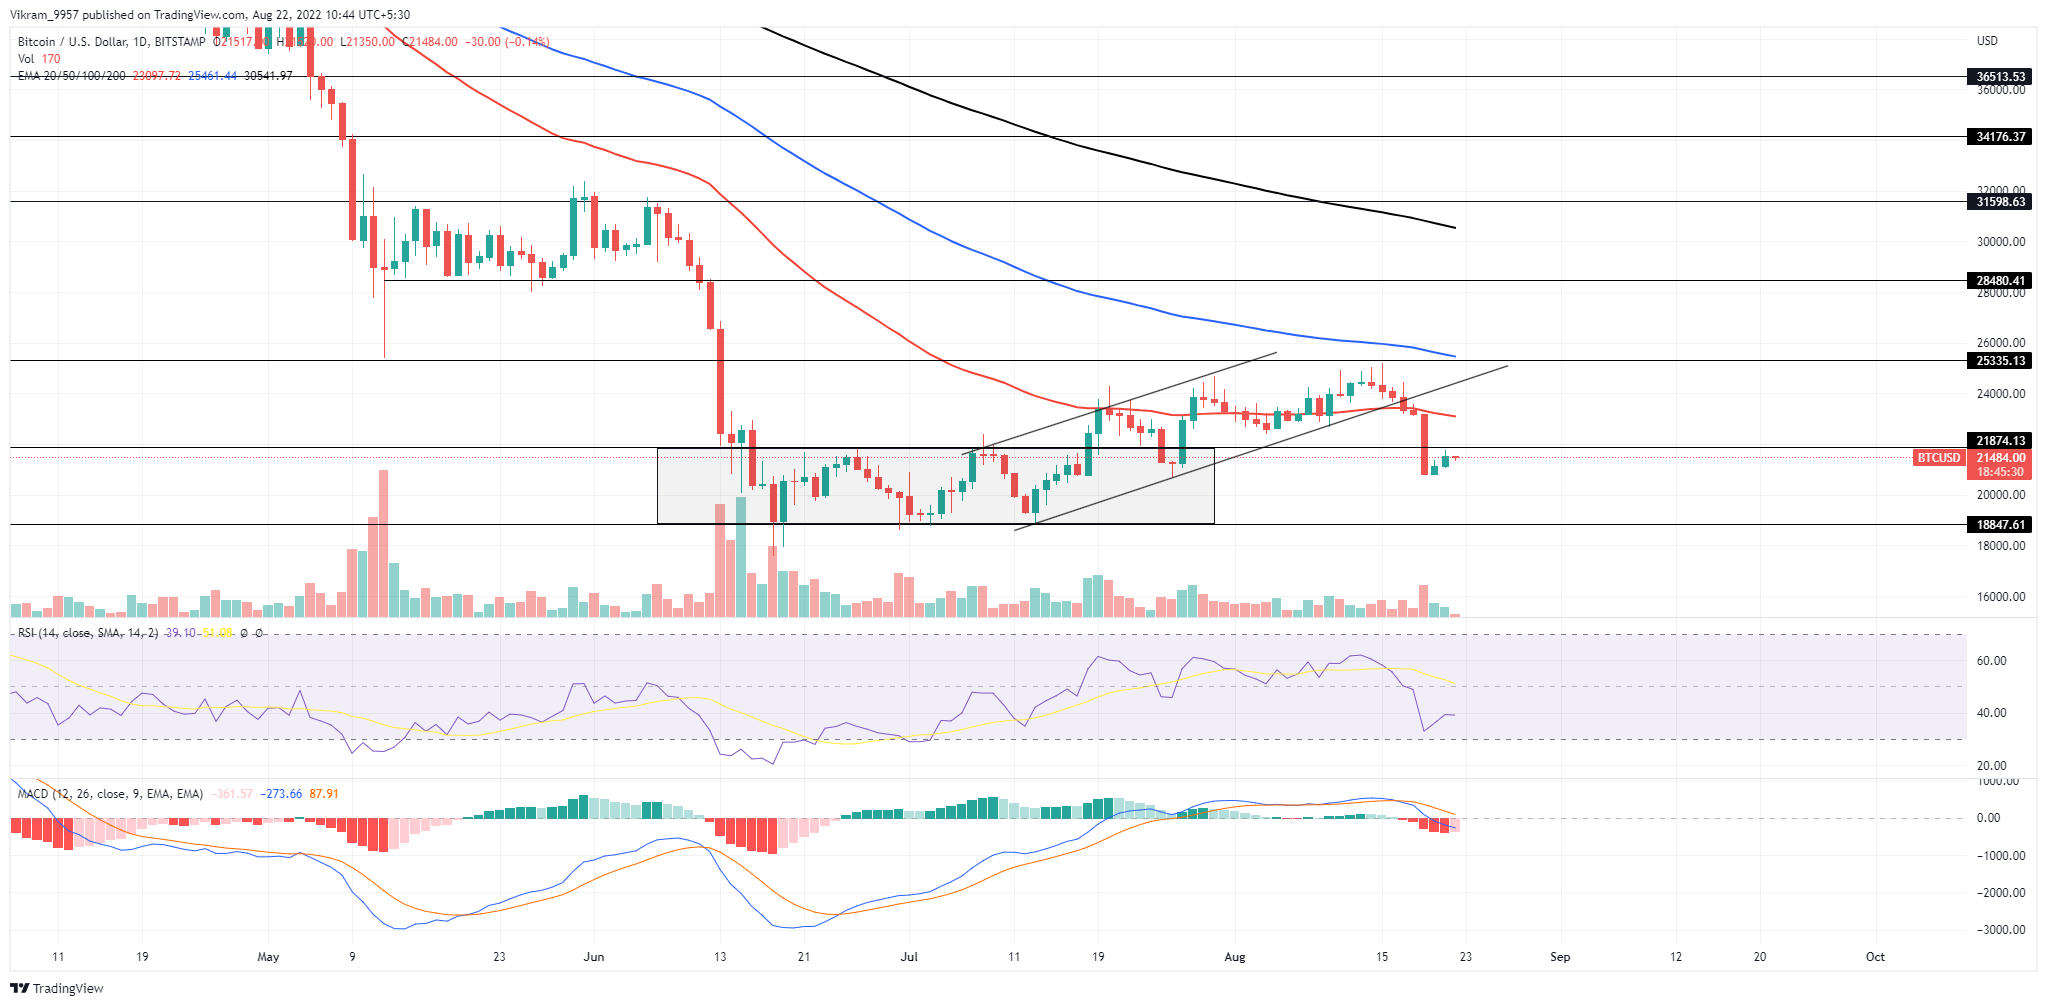
Source — Tradingview
BTC Technical Analysis
The BTC prices may shortly restart the bearish trend with a boom in trend momentum as a post-retest reversal rally. Moreover, the upcoming trend may test the crucial bottom support at the $18,847 mark resulting in a drop below the psychological mark of $20,000. As the market price falls below the 50-day EMA, the possibility of a bullish crossover between the 50 and 100-day EMA nullifies. The RSI indicator displays an extraordinary rise in the underlying bearishness as the RSI slope falls to the oversold boundary. Moreover, as the negative histograms intensify, the MACD indicator signals a selling opportunity with the increasing bearish gap between the fast and slow lines. Hence the technical indicators maintain a bearish bias for the upcoming trend. In brief, the BTC technical analysis projects a high likelihood of a downtrend crossing under the psychological mark of $20,000.
Upcoming Trend
BTC prices can reach the bottom of $18,875 if the buyers fail to assert dominance at the crucial support level of $20,000. However, the bullish reversal crossing above $21,875 can retest the 50-day EMA at $23,000. Resistance Levels: $21,875 and $23,000 Support Levels: $20,000 and $18,847


 Bitcoin
  Ethereum
  Tether
  USDC
USDC  Dogecoin
  Cardano
  Bitcoin Cash
  Polygon
  Litecoin
  LEO Token
  Hedera
  Stellar
  Cosmos Hub
  OKB
OKB  Maker
Maker  Algorand
  NEO
NEO  Gate
Gate  Synthetix Network
  KuCoin
  IOTA
IOTA  Tether Gold
  TrueUSD
  Enjin Coin
  Ravencoin
  Holo
Holo  0x Protocol
  Siacoin
  Basic Attention
  Decred
  Ontology
  Zcash
Zcash  Lisk
Lisk  Waves
Waves  DigiByte
  Numeraire
  Status
  Nano
Nano  Steem
Steem  Pax Dollar
  OMG Network
  BUSD
BUSD  Ren
Ren  Bytom
Bytom  Bitcoin Diamond
  HUSD
HUSD  Energi
  Augur
Augur