


Bullish Retest or a Drop to $20K for BTC? (Bitcoin Price Analysis)
Bitcoin’s price has been moving to the upside recently after rebounding from the $20K support area. However, it seems like the rally is coming to a halt, as the price is getting rejected from the $23K-$24K resistance level.
Technical Analysis
By Edris
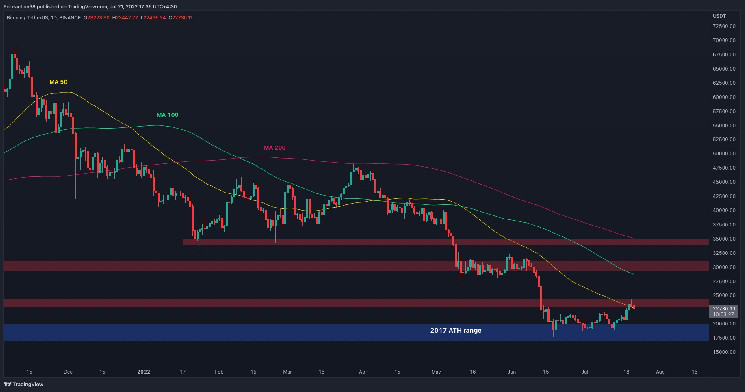
The Daily Chart
Presently, the 50-day moving average acts as an additional resistance, potentially pushing the price back lower towards the $20K mark. A bearish continuation could be expected in this case because the $20K level would be a much weaker barrier after holding the price multiple times. A bearish breakout from this level would likely cause another rapid crash, possibly hitting the $15k area in the short term.

On the other hand, a breakout above the $24K and the 50-day moving average levels would fail the bearish scenario, and a rally towards the $30K supply zone would be expected. However, the price action suggests the former is more probable.
The 4-Hour Chart
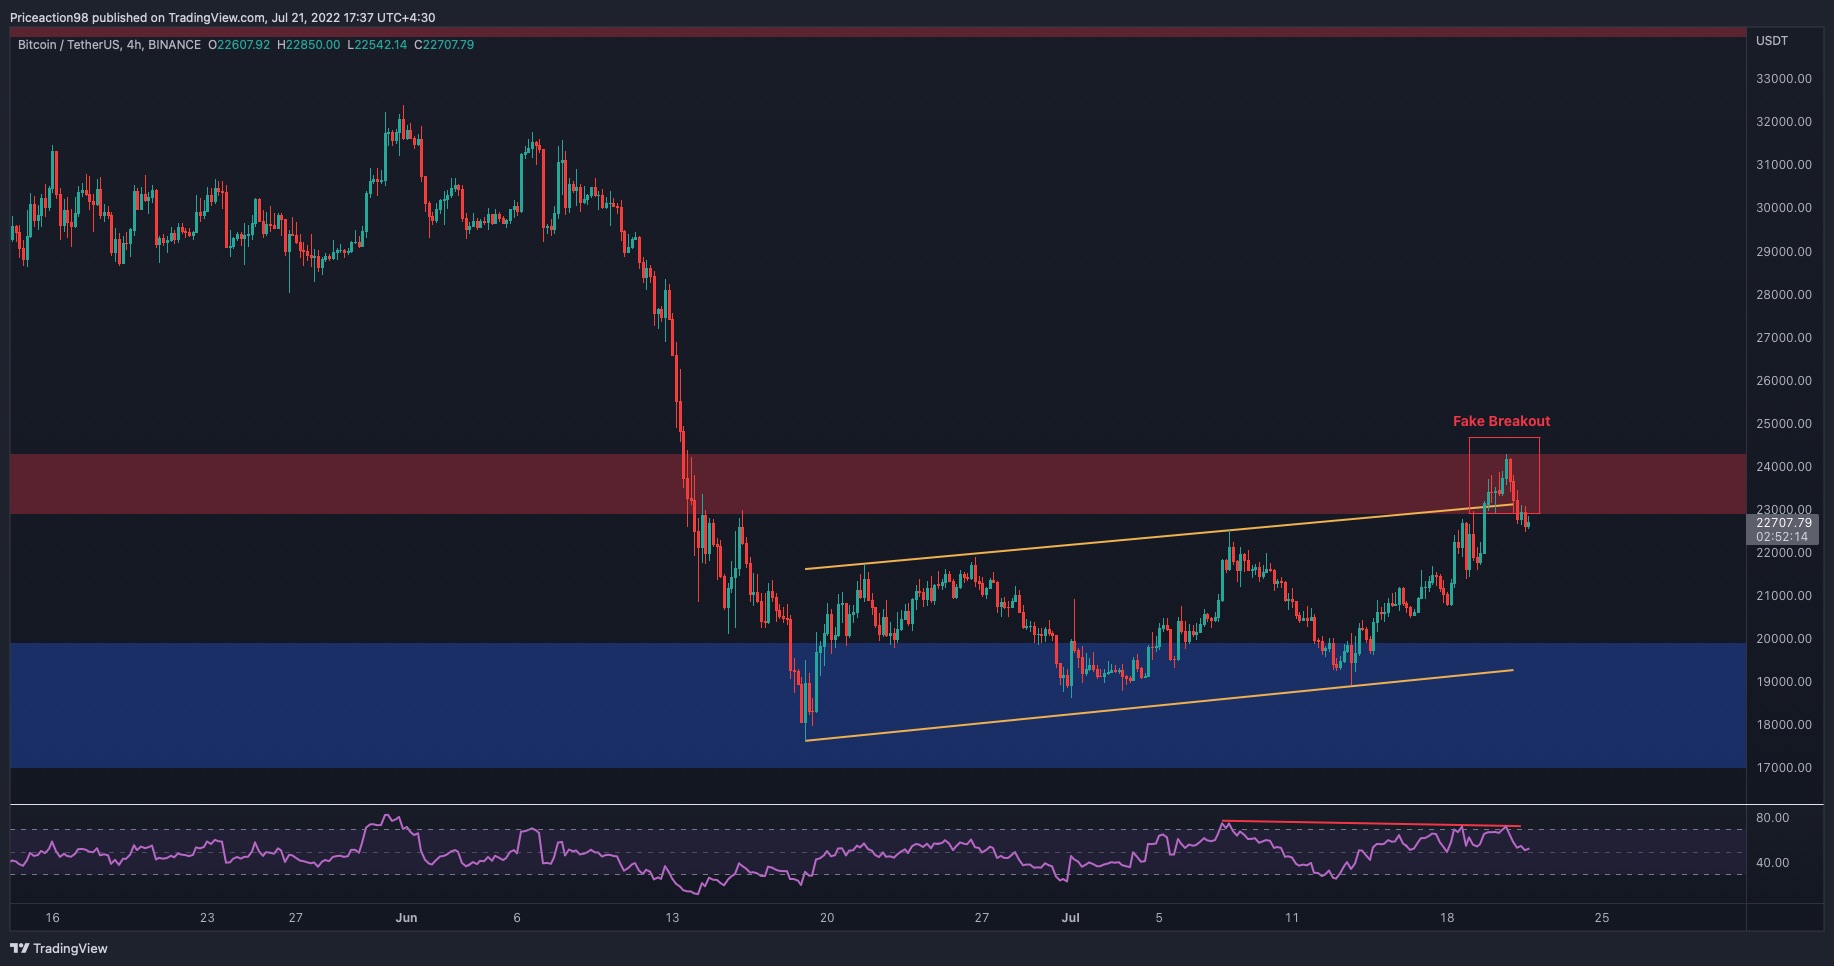
On the 4-hour timeframe, the price has finally broken above the bearish flag pattern which has been forming over the past month. However, the market failed to continue higher as the price dropped backed into the pattern, creating a fake bullish breakout. The RSI has also created a significant bearish divergence between the last couple of highs, indicating exhaustion of the uptrend and pointing to a potential bearish reversal. If the price breaks below the bearish flag pattern, a further bearish move and a new lower low would be expected in the next few weeks.
Sentiment Analysis
By Edris
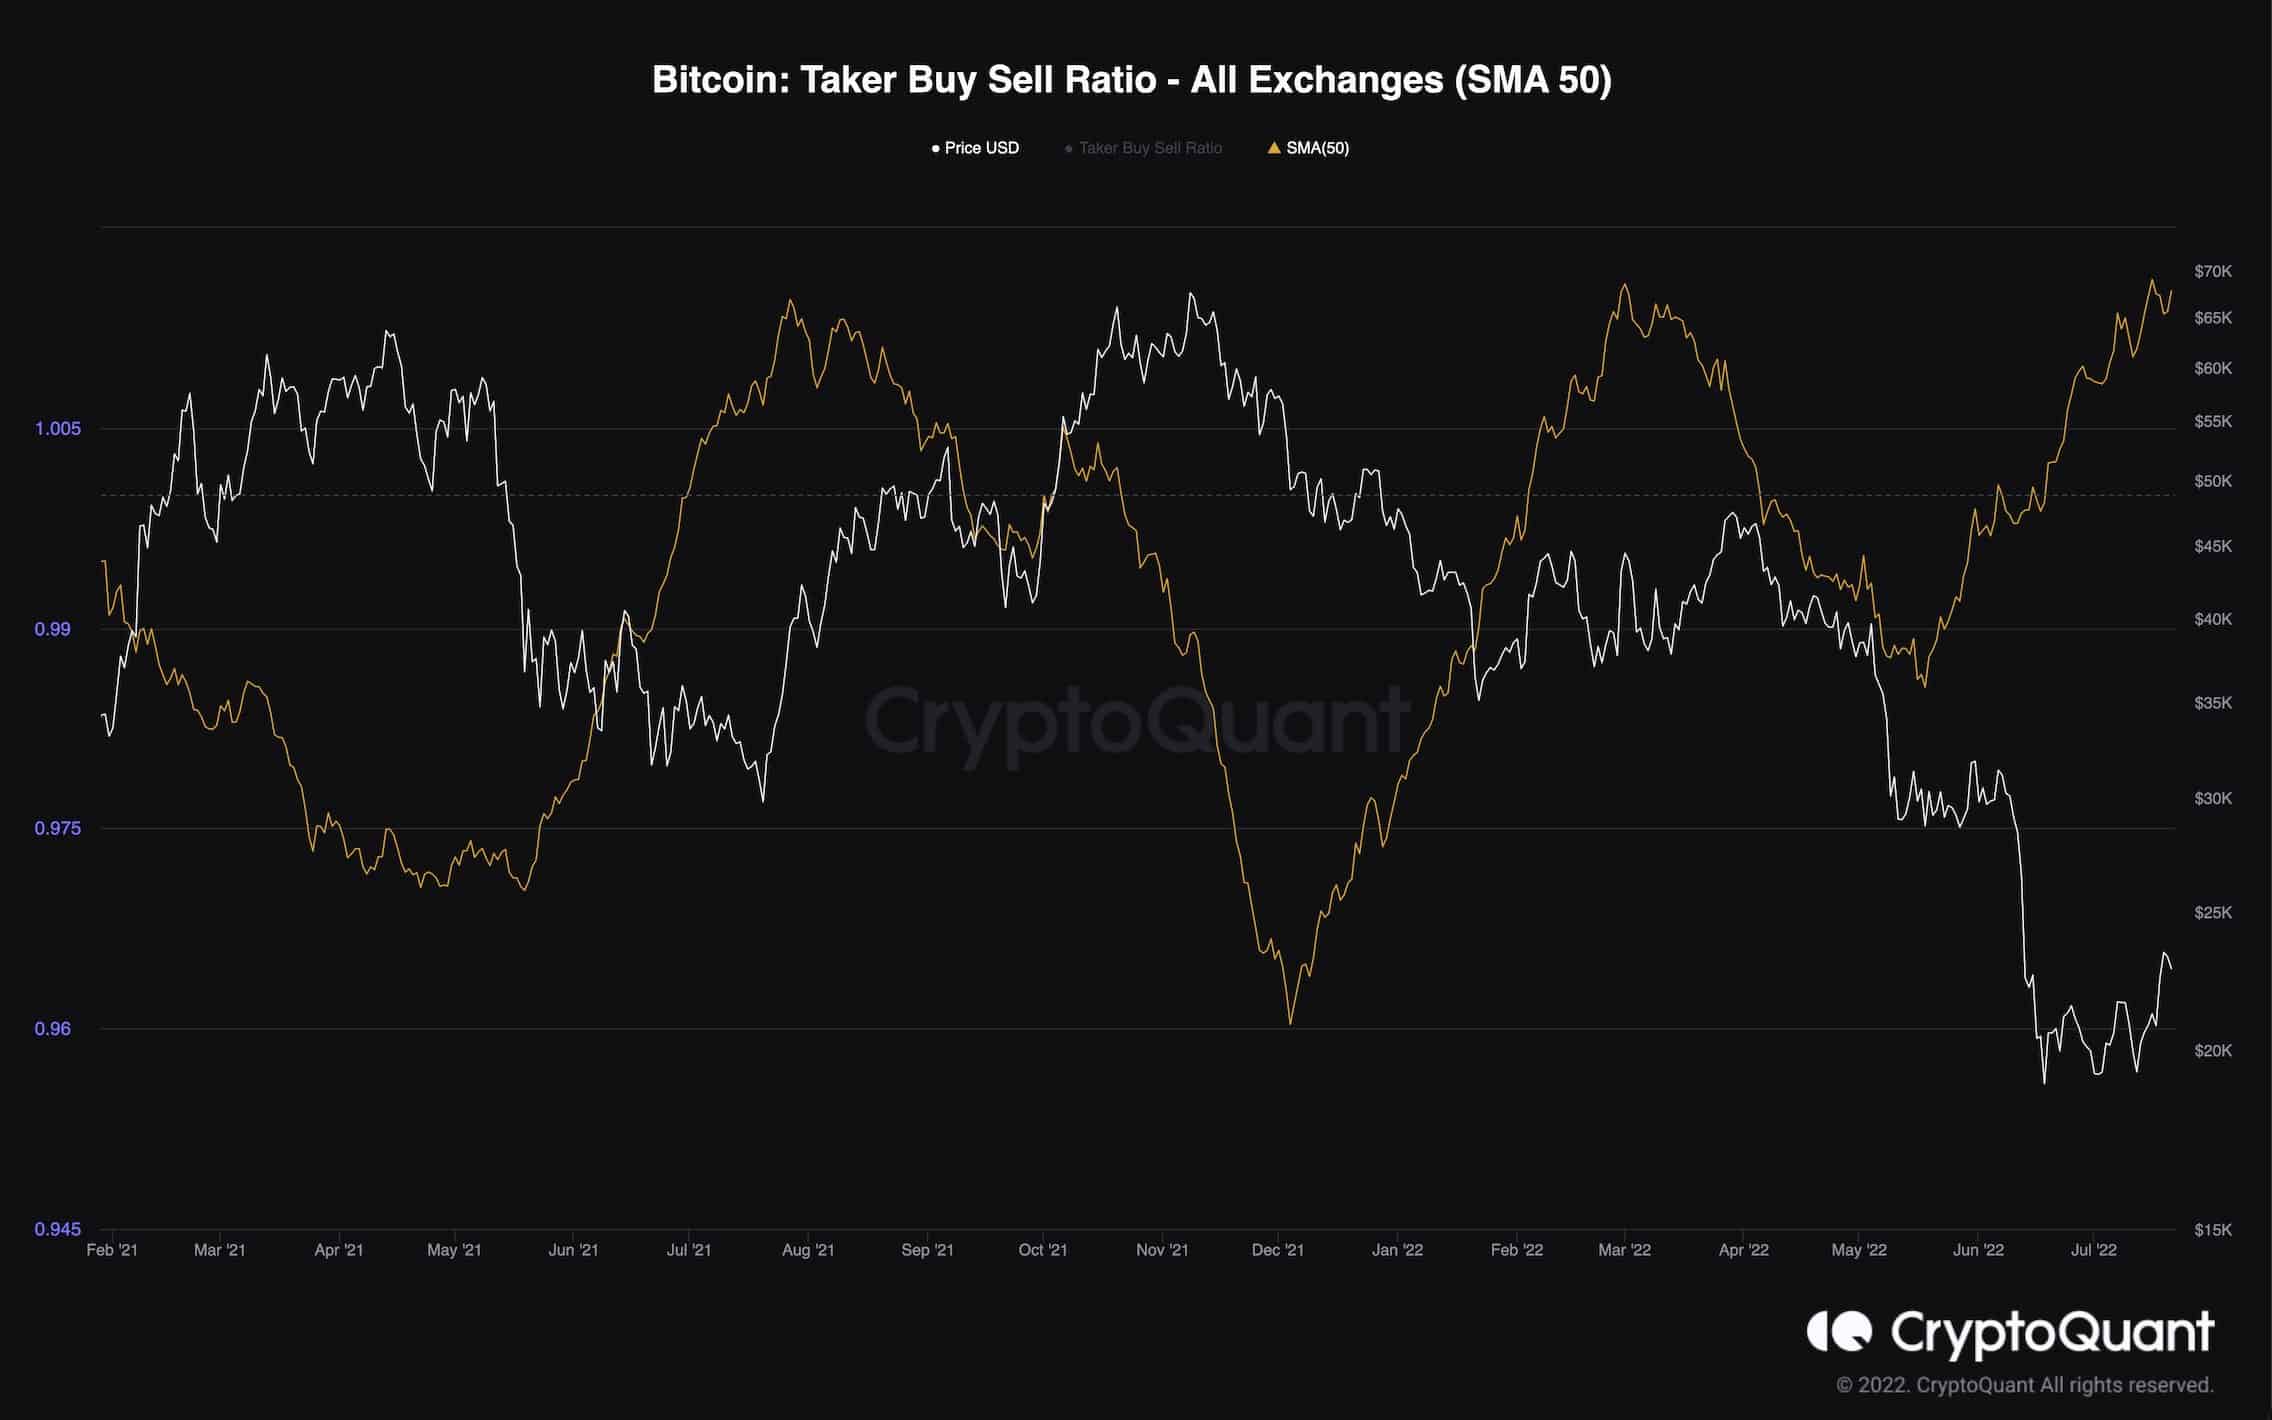
Bitcoin Taker Buy/Sell Ratio
Bitcoin’s price has been pulling back to the upside over the last few days after a relatively short consolidation at the $20K level earlier. To get a clue of whether this bullish move would be a sustained one or just another bull trap, it would be wise to analyze the futures market sentiment. The Taker Buy/Sell ratio is one of the most useful metrics to evaluate the futures market’s sentiment. This metric signals whether the buyers (values above 1) or the sellers (values below 1) are more aggressive and in control in the futures market.
It is evident that the buyers are dominant now, but this indicator has recently reached its high band showing a pre-decline weakness. If the Taker Buy/Sell ratio decreases over the next few weeks and drops below 1, a further bearish continuation would be expected as buyers’ exhaustion and the rising dominance of sellers would be demonstrated.
However, it is still too early to conclude that this scenario would occur as the metric is still trending higher, and there would be no reversal signal before a decline begins. So, the Taker Buy/Sell ratio should be monitored carefully over the next few days to determine the market’s short-term direction.


 Bitcoin
  Ethereum
  Tether
  USDC
USDC  Dogecoin
  Cardano
  Bitcoin Cash
  Polygon
  Litecoin
  LEO Token
  Hedera
  Stellar
  Cosmos Hub
  OKB
OKB  Maker
Maker  Algorand
  NEO
NEO  Gate
Gate  KuCoin
  Synthetix Network
  IOTA
IOTA  Tether Gold
  TrueUSD
  Enjin Coin
  Holo
Holo  Ravencoin
  Siacoin
  0x Protocol
  Basic Attention
  Ontology
  Decred
  Zcash
Zcash  Lisk
Lisk  Waves
Waves  DigiByte
  Numeraire
  Status
  Nano
Nano  Pax Dollar
  Steem
Steem  OMG Network
  BUSD
BUSD  Ren
Ren  Bytom
Bytom  Bitcoin Diamond
  HUSD
HUSD  Energi
  Augur
Augur