


Cardano price analysis: ADA falls flat to decline below $0.55 support

Cardano price analysis shows signs of bearish pressure coming into the market on the 24-hour price action, as price fell 4 percent to move as low as $0.5320. ADA fell below previous support at $0.55 after yesterday’s price action showed strong indication of a continuation of the current uptrend. While today’s price action saw ADA fall flat, price currently remains in technical uptrend and could break above the next resistance point at $0.60 soon. This will be greatly dependent on the release of the key US Retail Sales data for July, which if not disruptive could provide an upturn in sentiment for Cardano and push price upwards to $0.67-$0.69.
The larger cryptocurrency market remained largely in the hands of bears over the past 24 hours, as Bitcoin fell down to $23,500 and Ethereum moved below the $2,000 mark to settle at $1,800. Among leading Altcoins, Ripple showed some consolidation to move up to $0.37, whereas Dogecoin crashed 2 percent down to $0.082. Meanwhile, Solana dropped more than 3 percent to move as low as $41.6 and Polkadot declined down to $8.5 following a 3 percent downtrend.
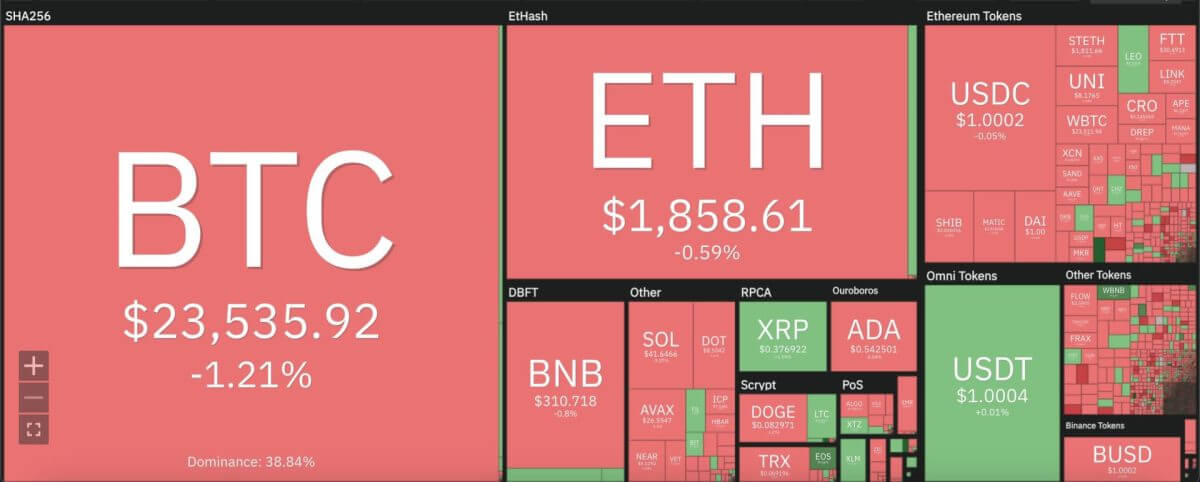
Cardano price analysis: Cryptocurrency heat map. Source: Coin360
Cardano price analysis: Price falls below 50EMA on 24-hour chart
On the 24-hour candlestick chart for Cardano price analysis, price can be seen turning bearish once again after recovery yesterday to move back above $0.55. ADA lowered down to $0.53 over the past 24 hours with greater volatility coming into the market. Price breached the 9 and 21 day moving averages, along with the crucial 50-day exponential moving average (EMA) for the first time since initially crossing the then resistance at $0.55.
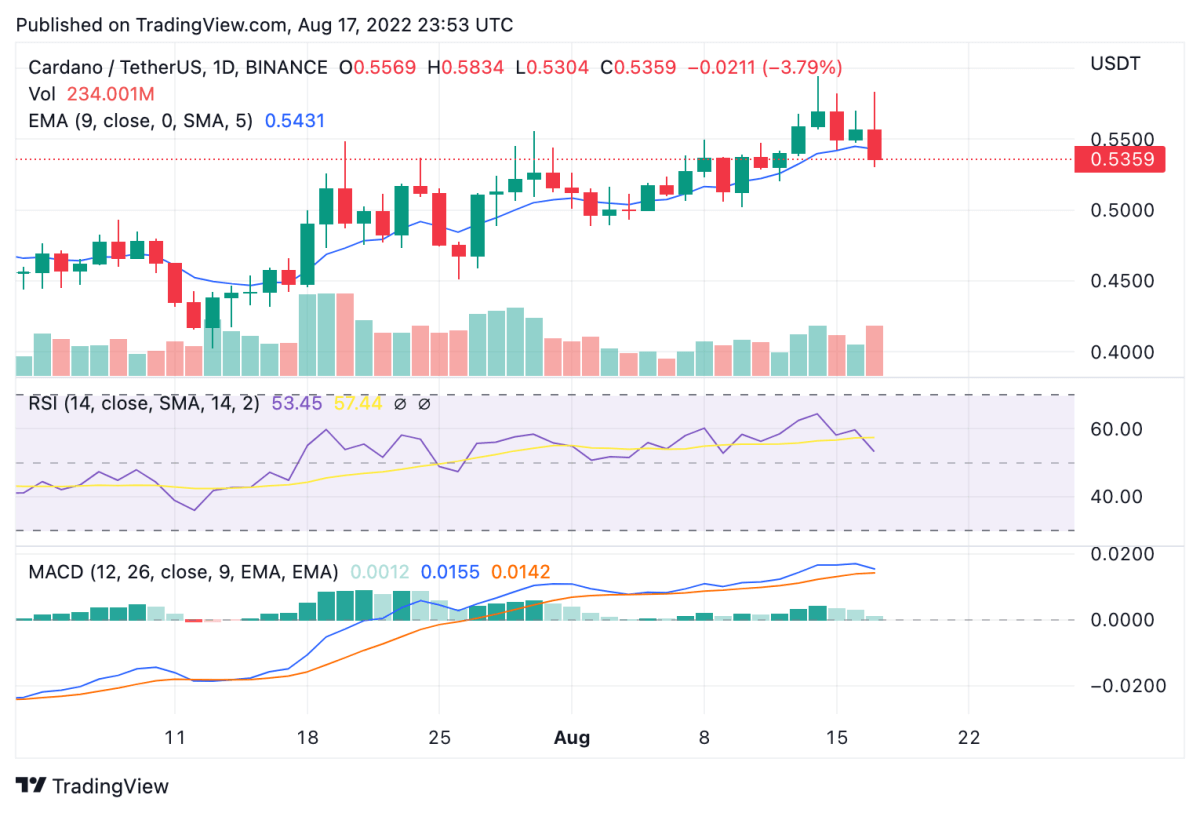
Cardano price analysis: 24-hour chart. Source: Trading View
The 24-hour relative strength index (RSI) also shows a downward trend for ADA market valuation, as it slipped from over 60 to move down to 53.45 today. Meanwhile trading volume went up by 35 percent over the past 24 hours, suggesting major price action was with sellers. Meanwhile, the moving average convergence divergence (MACD) curve is shaping to form a bearish divergence for the first time since August 14, 2022. If price breaks below $0.53 over the daily chart, it could quickly tumble further down to test the 50DMA at $0.50, which would open the door for a potential return to $0.40.
Disclaimer. The information provided is not trading advice. Cryptopolitan.com holds no liability for any investments made based on the information provided on this page. We strongly recommend independent research and/or consultation with a qualified professional before making any investment decisions.


 Bitcoin
  Ethereum
  Tether
  USDC
USDC  Dogecoin
  Cardano
  Bitcoin Cash
  Polygon
  Litecoin
  LEO Token
  Hedera
  Stellar
  Cosmos Hub
  OKB
OKB  Maker
Maker  Algorand
  NEO
NEO  Gate
Gate  KuCoin
  Synthetix Network
  IOTA
IOTA  Tether Gold
  TrueUSD
  Enjin Coin
  Holo
Holo  Ravencoin
  0x Protocol
  Siacoin
  Basic Attention
  Decred
  Ontology
  Zcash
Zcash  Lisk
Lisk  Waves
Waves  DigiByte
  Numeraire
  Status
  Nano
Nano  Pax Dollar
  Steem
Steem  OMG Network
  BUSD
BUSD  Ren
Ren  Bytom
Bytom  Bitcoin Diamond
  HUSD
HUSD  Energi
  Augur
Augur