


Cardano price analysis: ADA rides bullish wave as buyers target $0.58 next
Cardano price analysis reflects a bullish bias that is likely to take the pair above $0.58 over the weekend. The hourly charts are laden with green candlesticks for the day. The bulls are driving the price action higher on the back of low volatility and testing the higher resistance at $0.57 price level.
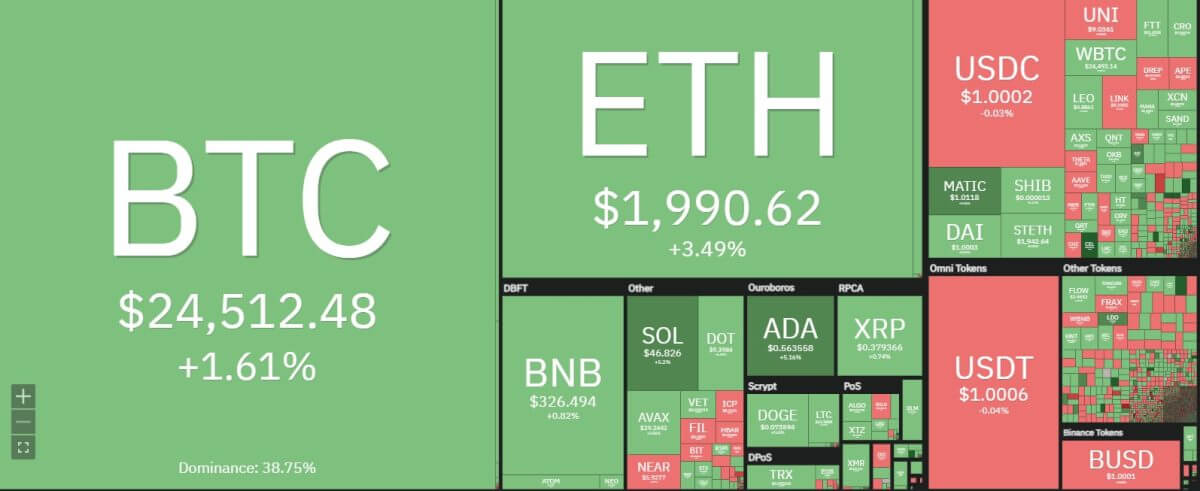
Source: Coin360
Buyers are creating a momentum of heavy buying pressure in the ADA/USD pair. The pair faces a critical resistance at $0.57, and then at $0.58 zone. For the second consecutive day, Cardano has pushed up higher towards $0.57 level. The bullish sign of ‘three white soldiers’ is emerging on the hourly charts which will give further boost to the pair in the upcoming week.
Cardano price movement in the last 24 hours: Strong positive trend on the cards
The way Cardano is making higher highs compared to other recovering cryptocurrencies, the pair is starting to look extremely bullish. The reverse ‘head and shoulders’ pattern is also helping the bullish case scenario as the pair tries to close the day beyond $0.56. The breakout will only help strengthen the upward rally including the higher volume data. Cardano price analysis still suggests that a reliable breakout is still to emerge on the charts.
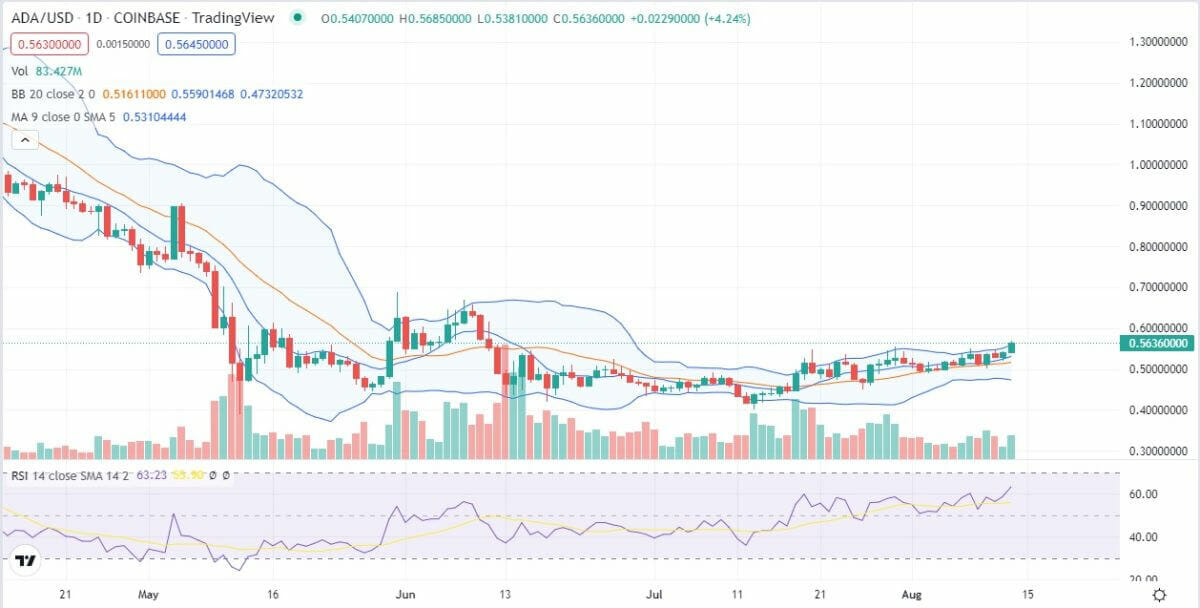
Source: TradingView
The downtrend on the hourly charts is definitely over and the traders are looking for higher prices. The neck of the ;head and shoulders’ pattern is broken successfully and the day traders are awaiting further positive signs to create small rallies. A renewed pressure over the weekend can help create more upside as reflected in various technical indicators.
ADA/USD 4-hour chart: Technical indicators signal more green ahead
A range of technical indicators is showing signs of higher prices up ahead. The bullish closing can help the pair move ahead of the neckline and even chart course towards $0.60 in the long-term scenario. The RSI remains steady above 55 thereby signalling bulls to purchase more as per Cardano price analysis.
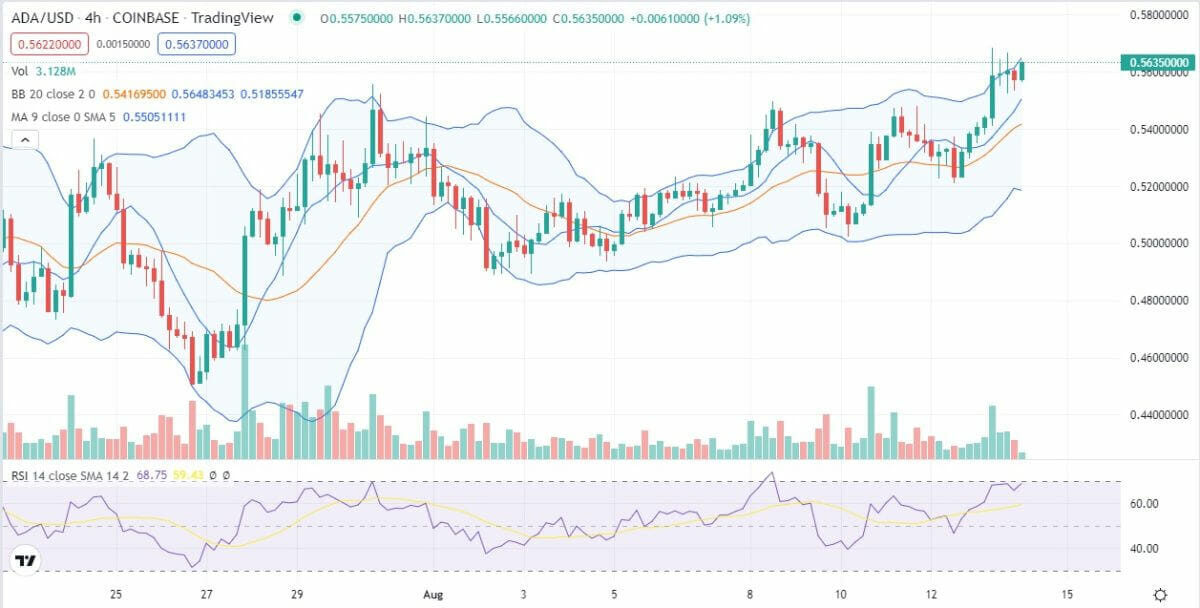
Source: TradingView
The MACD indicator shows the signal line treading higher path and the histogram is moving upwards as well. Cardano price analysis looks bullish as per the technical indicators on the hourly charts.
Another momentum oscillator, the MACD line crosses above the signal line above zero with rising histograms indicating a continuation of the upside move for now. The ascending triangle pattern is supporting the ADA/USD pair underneath all the way till $0.54 support zone. On the contrary, a sharp drop in prices can take the ADA towards $0.50 level.
Cardano price analysis conclusion: Slow weekend can help ADA consolidate gains
If the bulls are able to keep the prices above $0.55 over the weekend, the prices can consolidate towards the higher side. The volume contraction pattern is also hinting at a higher price target of $0.57 in the coming hours. the support underneath lies at $0.54 where more buying can take place.
Disclaimer. The information provided is not trading advice. Cryptopolitan.com holds no liability for any investments made based on the information provided on this page. We strongly recommend independent research and/or consultation with a qualified professional before making any investment decisions.


 Bitcoin
  Ethereum
  Tether
  USDC
USDC  Dogecoin
  Cardano
  Bitcoin Cash
  Polygon
  Litecoin
  LEO Token
  Hedera
  Stellar
  Cosmos Hub
  OKB
OKB  Maker
Maker  Algorand
  NEO
NEO  Gate
Gate  Synthetix Network
  KuCoin
  IOTA
IOTA  Tether Gold
  TrueUSD
  Enjin Coin
  Ravencoin
  Holo
Holo  0x Protocol
  Siacoin
  Basic Attention
  Decred
  Ontology
  Zcash
Zcash  Lisk
Lisk  Waves
Waves  DigiByte
  Numeraire
  Status
  Nano
Nano  Steem
Steem  Pax Dollar
  OMG Network
  BUSD
BUSD  Ren
Ren  Bytom
Bytom  Bitcoin Diamond
  HUSD
HUSD  Energi
  Augur
Augur