


Cardano price analysis: ADA stays on course to test $0.6 resistance
Cardano price analysis remains bullish, as price continues to trend upwards along a bullish hammer pattern on the daily chart. The extended uptrend initiated on July 27, 2022 with price set at $0.45 and has taken ADA price up to a 30-day high at $0.55. Price at the time of writing is consolidating just under the $0.55 resistance forming a triple top pattern around the mark. ADA price has racked up more than 22 percent over the past 5 days, and could yet rise as high as the $0.6 resistance over the coming week.
The larger cryptocurrency market showed mixed signals over the past 24 hours, as Bitcoin moved closer to the $24,000 mark and Ethereum consolidated at the $1,700 level. Among leading Altcoins, Ripple dropped down to $0.39 with a minor decline, while Dogecoin also dropped slightly to $0.07. Solana dropped 4 percent to $0.44, whereas Polkadot soared almost 6 percent to move up to $9.03.
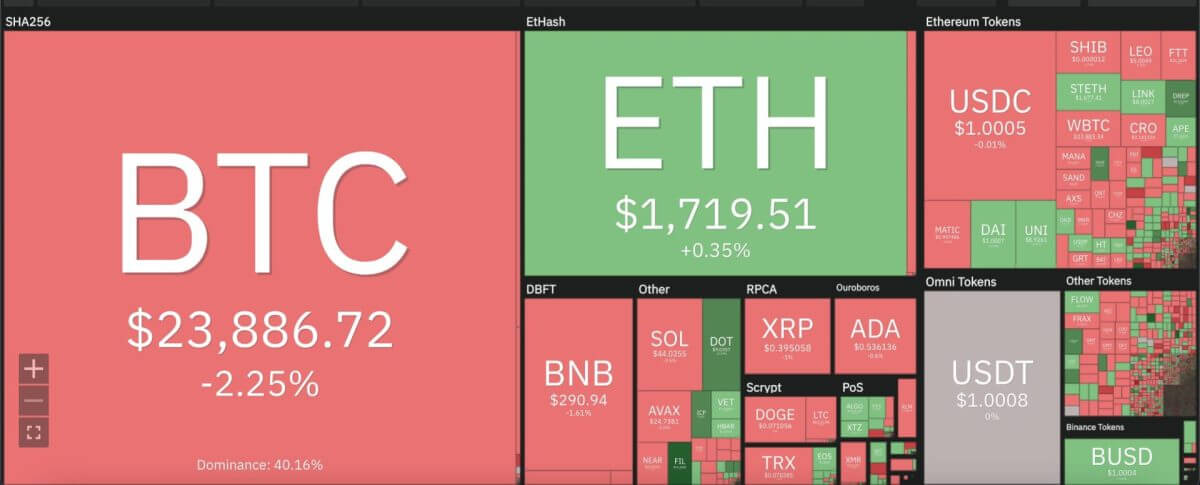
Cardano price analysis: Cryptocurrency heat map. Source: Coin360
Cardano price analysis: ADA market valuation subsides on daily chart
On the 24-hour candlestick chart for Cardano price analysis, price can be seen forming an extended ascending triangle pattern to reach a 30-day high at $0.55. The uptrend follows a brief sideways pattern that had price stuck between a narrow range around $0.45-$0.50. Price remains above the 9 and 21-day moving averages, along with the crucial 50-day exponential moving average (EMA) at $0.50. The distance between price and 50EMA will be crucial if ADA is to hit resistance at $0.6 over the coming trading sessions.
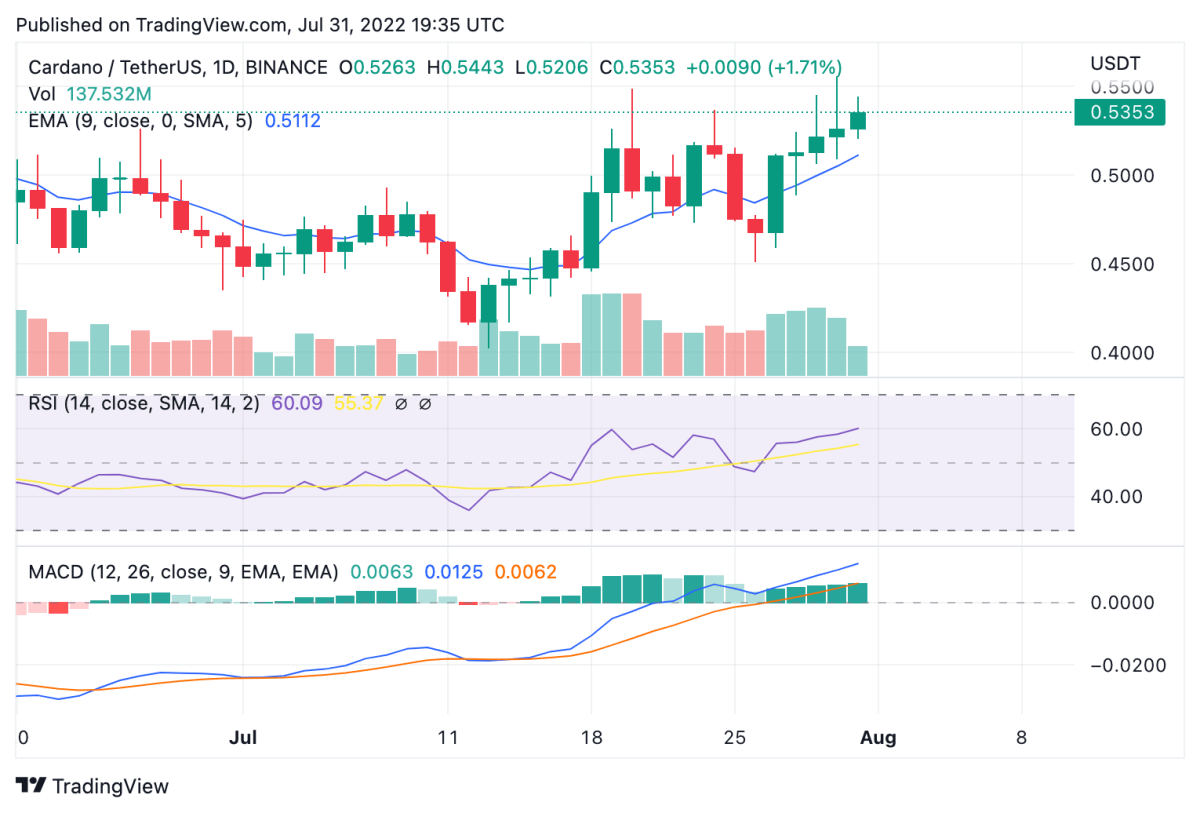
Cardano price analysis: 24-hour chart. Source: Trading View
The 24-hour relative strength index (RSI) can be seen approaching the overbought zone at 60.09, which could either be a sign of a bullish breakout, or it could drag price downward. The 24-hour trading volume for ADA suffered a 26 percent decline, suggesting traders are holding out to determine the upcoming pattern. Meanwhile, the moving average convergence divergence (MACD) curve remains bullish and can be seen strengthening along a bullish divergence and forming higher lows above the neutral zone.
Disclaimer. The information provided is not trading advice. Cryptopolitan.com holds no liability for any investments made based on the information provided on this page. We strongly recommend independent research and/or consultation with a qualified professional before making any investment decisions.


 Bitcoin
  Ethereum
  Tether
  USDC
USDC  Dogecoin
  Cardano
  Bitcoin Cash
  Polygon
  Litecoin
  LEO Token
  OKB
OKB  Stellar
  Cosmos Hub
  Hedera
  Maker
Maker  Algorand
  NEO
NEO  Synthetix Network
  Gate
Gate  KuCoin
  IOTA
IOTA  Tether Gold
  TrueUSD
  Enjin Coin
  0x Protocol
  Ravencoin
  Holo
Holo  Siacoin
  Basic Attention
  Zcash
Zcash  Decred
  Ontology
  Waves
Waves  Lisk
Lisk  DigiByte
  Numeraire
  Status
  Nano
Nano  Pax Dollar
  Steem
Steem  OMG Network
  BUSD
BUSD  Ren
Ren  Bitcoin Diamond
  Bytom
Bytom  HUSD
HUSD  Energi
  Augur
Augur