


ChainLink price analysis: LINK declines to $6.7

ChainLink price analysis for July 23, 2022, reveals the market following a complete bearish movement, obtaining some positive momentum, signifying a gain of positivity for the LINK market. The price of ChainLink has remained negative over the past few hours. Today, the price crashed and went from $7.02 to $6.6. However, the market started to increase in value soon after and regained most of its value. Moreover, ChainLink has increased and reached $6.7, just shying away from the $7 mark.
The current price of ChainLink is $6.7, with a trading volume of $334,460,031. Chainlink has been down 3.47% in the last 24 hours. ChainLink currently ranks at #24 with a live market cap of $3,148,874,481.
LINK/USD 4-hour price analysis: Latest developments
ChainLink price analysis reveals the market’s volatility following a closing movement. This means that the price of ChainLink is becoming less prone to the movement towards either extreme, showing consistent dynamics. The Bollinger’s band’s upper limit is $7.3, which is the strongest resistance for LINK. Conversely, the lower limit of Bollinger’s band is $6.5, which is the most substantial support for LINK.
The LINK/USD price appears to be moving under the price of the Moving Average, signifying a bearish movement. The market’s trend seems to be dominated by bears. The LINK/USD price appears to be moving upward, illustrating an increasing market. The market appears to be showing bearish potential, but the trend might shift soon in favoring a positive movement.
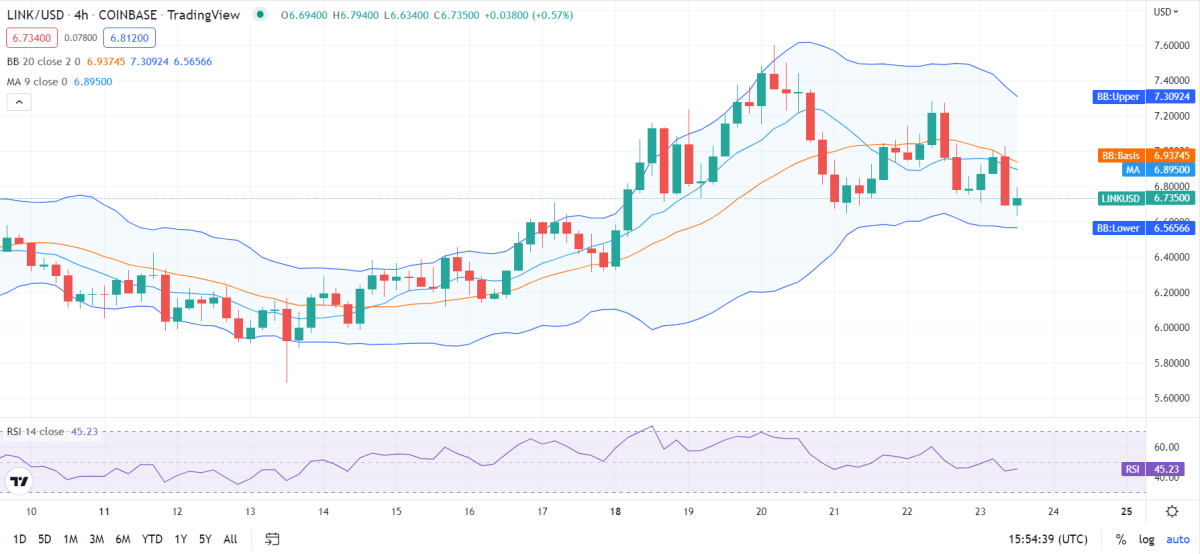
LINK/USD 4-hour price chart source: TradingView
ChainLink price analysis reveals that the Relative Strength Index (RSI) is 45, showing a stable cryptocurrency stock. This means that the cryptocurrency falls into the central neutral region. Furthermore, the RSI appears to move upwards, indicating an increasing market. The dominance of buying activity causes the RSI score to Increase.
ChainLink price analysis for 1-day
ChainLink price analysis reveals the market’s volatility following an increasing movement, which means that the price of ChainLink is becoming more prone to experience variable change on either extreme. The Bollinger’s band’s upper limit is $7.1, serving as LINK’s strongest resistance. Conversely, the lower limit of Bollinger’s band is at $5.8, which is the most substantial support for LINK.
The LINK/USD price appears to be moving under the price of the Moving Average, signifying a bearish movement. On the other hand, the market’s trend seems to have shown bullish dynamics in the last few days. As a result, the market has decided on a positive approach. However, yesterday the market broke, and the market started opening its volatility. This change could’ve played a crucial role in the development of ChainLink.
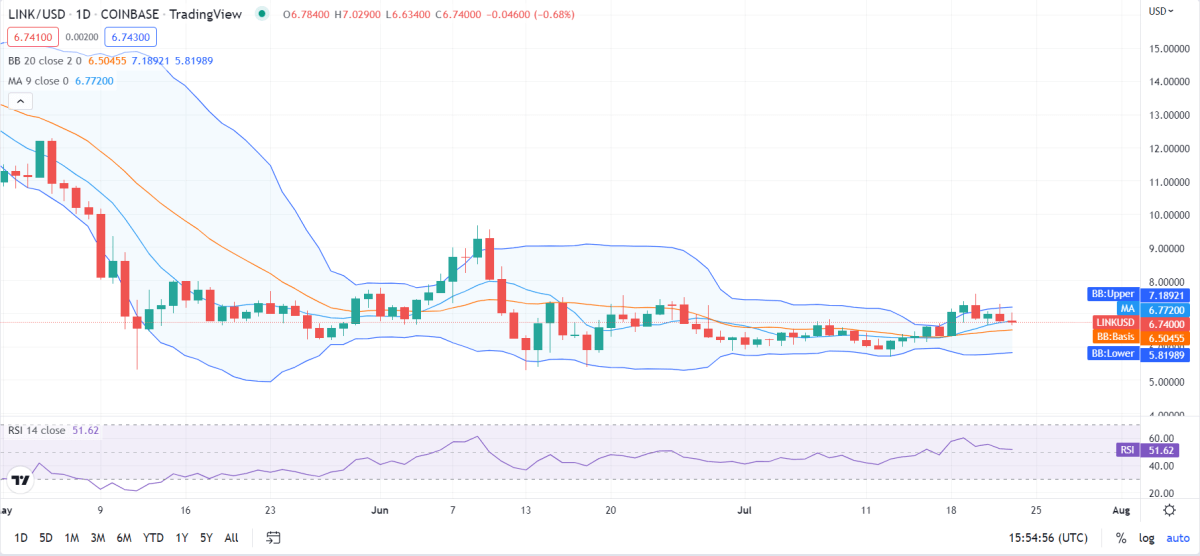
LINK/USD 1-day price chart source: TradingView
Chainlink price analysis shows the Relative Strength Index (RSI) to be 51, signifying a stable cryptocurrency. This means that the cryptocurrency falls in the central neutral region. Furthermore, the RSI path seems to have shifted to a linear movement. The constant RSI score also means equivalent buying and selling activities.
ChainLink Price Analysis Conclusion
Chainlink price analysis reveals the cryptocurrency follows an uncertain trend with much room for activity on either extreme. Moreover, the market’s current condition appears to be following a negative approach, as it shows the potential to move to either extreme. Therefore, we can assume that the bears will start making their moves soon and engulf the market completely.
Disclaimer. The information provided is not trading advice. Cryptopolitan.com holds no liability for any investments made based on the information provided on this page. We strongly recommend independent research and/or consultation with a qualified professional before making any investment decisions.


 Bitcoin
  Ethereum
  Tether
  USDC
USDC  Dogecoin
  Cardano
  Bitcoin Cash
  Polygon
  Litecoin
  LEO Token
  Hedera
  Stellar
  Cosmos Hub
  OKB
OKB  Maker
Maker  Algorand
  NEO
NEO  Gate
Gate  KuCoin
  Synthetix Network
  IOTA
IOTA  Tether Gold
  TrueUSD
  Enjin Coin
  Holo
Holo  Ravencoin
  0x Protocol
  Siacoin
  Basic Attention
  Ontology
  Decred
  Zcash
Zcash  Waves
Waves  Lisk
Lisk  DigiByte
  Numeraire
  Status
  Nano
Nano  Pax Dollar
  Steem
Steem  OMG Network
  BUSD
BUSD  Ren
Ren  Bytom
Bytom  Bitcoin Diamond
  HUSD
HUSD  Energi
  Augur
Augur