


Chiliz (CHZ) Triples in Price Since June Lows: Biggest Weekly Gainers
Be[in]Crypto takes a look at the five cryptocurrencies that increased the most last week, more specifically, from Aug 19 to 26.
These cryptocurrencies are:
- EOS (EOS): 25.85%
- Theta Fuel (TFUEL): 19.63%
- Chiliz (CHZ): 18.31%
- Cosmos (ATOM): 18.14%
- Decred (DCR): 12.63%
EOS
EOS has been increasing since June 18 and broke out from a descending resistance line on Aug. 12. The breakout led to a high of $1.95 on Aug 22.
This caused a rejection from the $1.90 resistance area and created a long upper wick. EOS has been falling since. If the decrease continues, the closest support area is at $1.40.
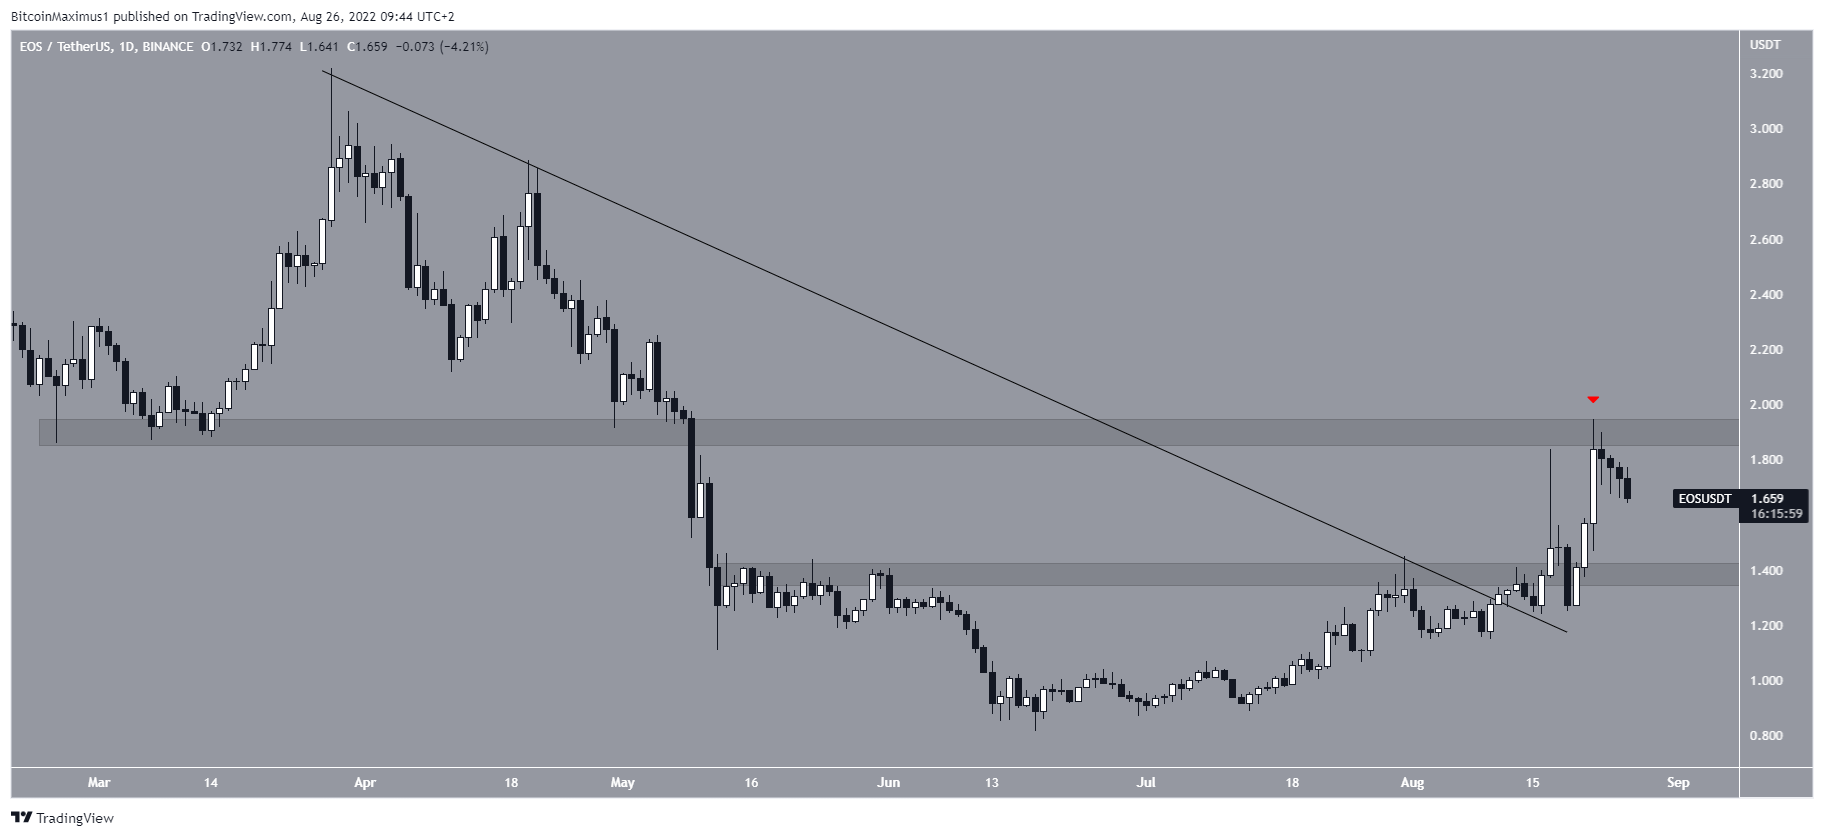
EOS/USDT Chart By TradingView
TFUEL
TFUEL has been increasing inside an ascending parallel channel since June 18. On Aug 23, it bounced at the support line of the channel and initiated a sharp upward movement (green icon). This caused a reclaim of the middle of the channel on Aug 25.
The closest resistance area is at $0.077. If TFUEL is successful in moving above it, a breakout from the channel would be expected.
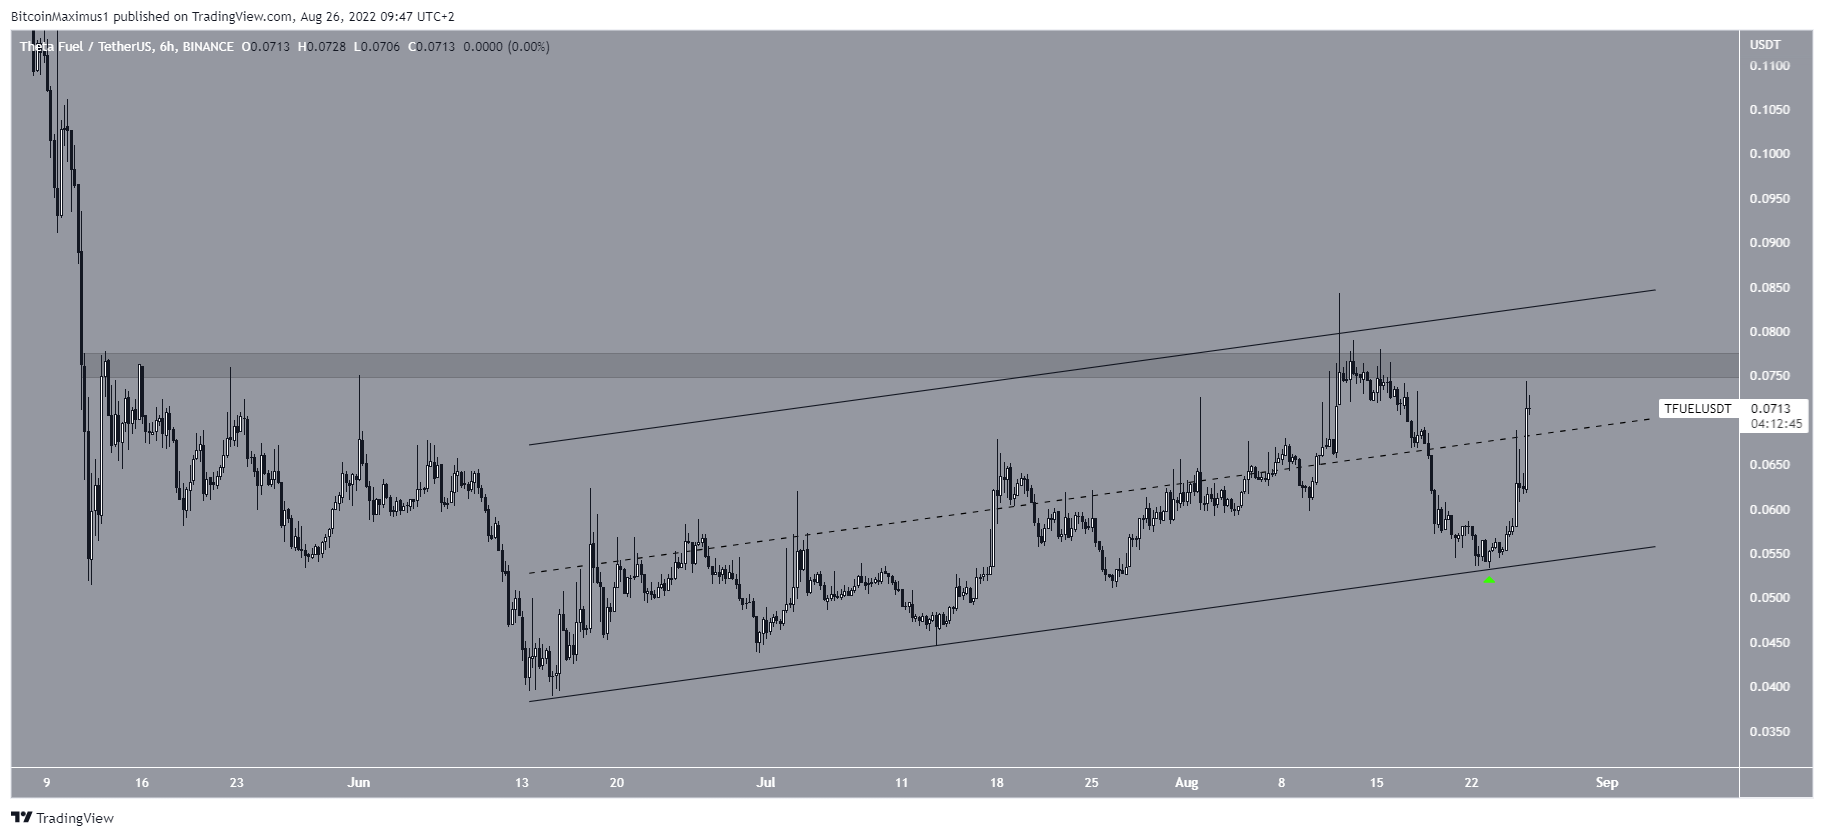
TFUEL/USDT Chart By TradingView
CHZ
CHZ has been increasing since June 18. The upward movement caused a breakout from a descending resistance line and led to a high of $0.26 on Aug 23.
The entire upward movement looks like a completed five wave structure. However, CHZ was rejected by the $0.28 resistance area (red icon) and has been decreasing since. If the downward movement continues, the closest support area is at $0.155.
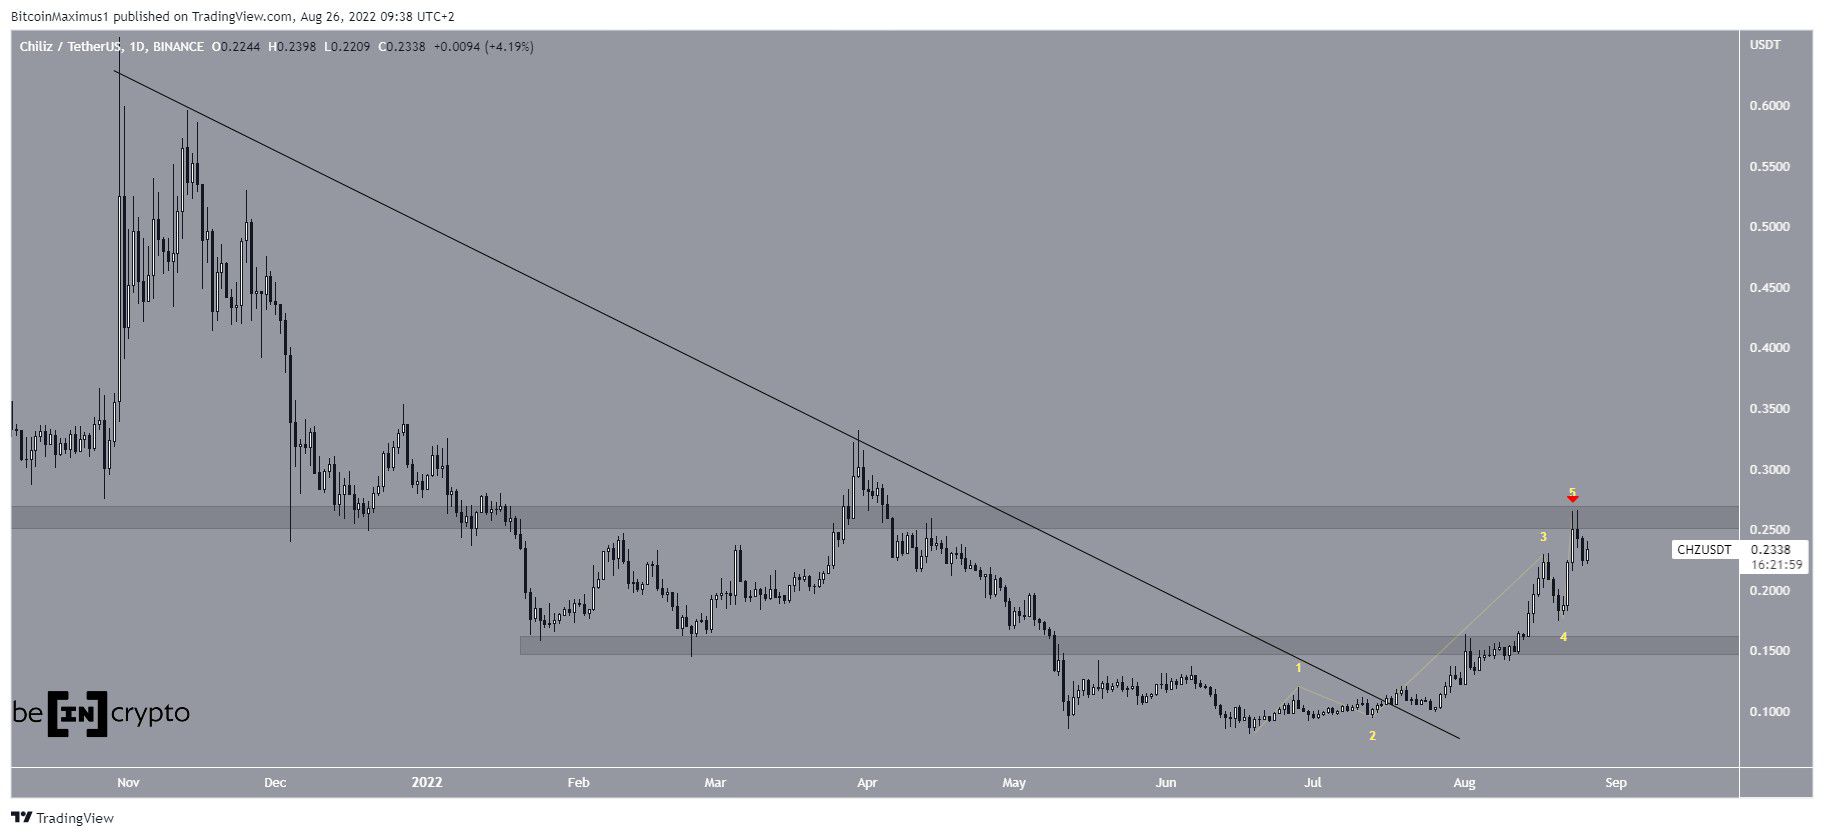
CHZ/USDT Chart By TradingView
ATOM
Similarly to TFUEL, ATOM has been increasing inside an ascending parallel channel since June 19. The movement inside it has been extremely choppy, suggesting that the movement is corrective. If so, a breakdown from the channel would be likely.
On Aug 23, ATOM was rejected by the resistance line of the channel (red icon). A decrease below the middle of the channel would make a breakdown more likely.
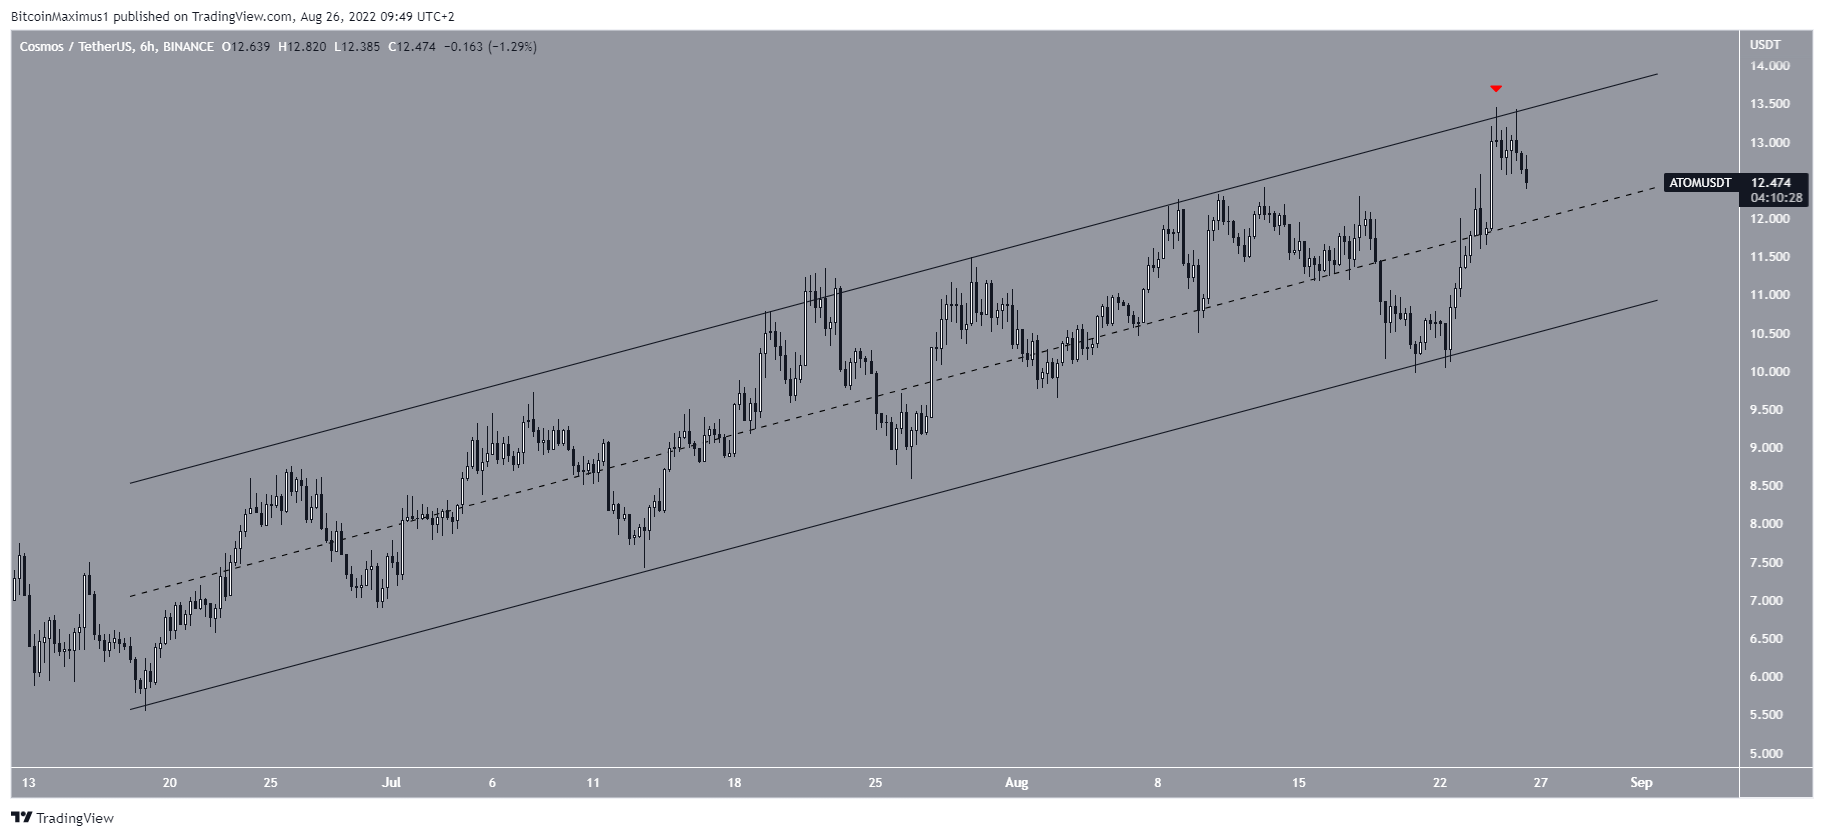
ATOM/USDT Chart By TradingView
DCR
DCR has been decreasing underneath a descending resistance line since Dec 2021. The line has so far caused four rejections (red icons), the most recent on Aug 5.
The trend cannot be considered bullish until DCR manages to break out from this line.
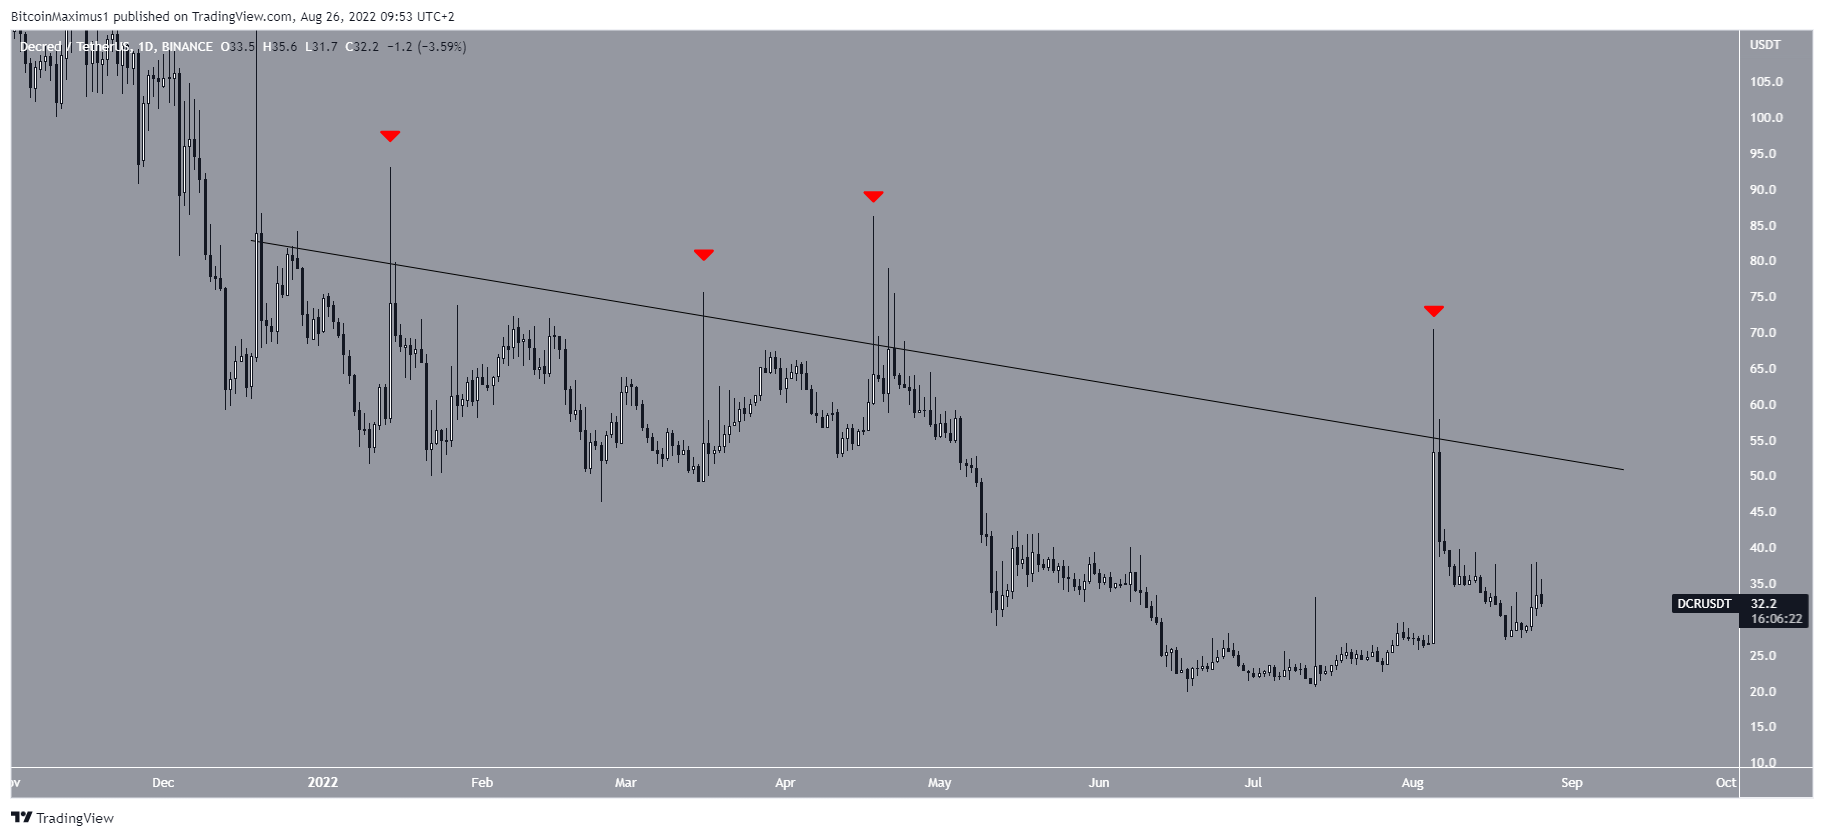
DCR/USDT Chart By TradingView
For Be[in]Crypto’s latest Bitcoin (BTC) analysis, click here


 Bitcoin
  Ethereum
  Tether
  USDC
USDC  Dogecoin
  Cardano
  Bitcoin Cash
  Polygon
  Litecoin
  LEO Token
  Hedera
  Stellar
  Cosmos Hub
  OKB
OKB  Maker
Maker  Algorand
  NEO
NEO  Gate
Gate  KuCoin
  Synthetix Network
  IOTA
IOTA  Tether Gold
  TrueUSD
  Enjin Coin
  Holo
Holo  Ravencoin
  Siacoin
  0x Protocol
  Basic Attention
  Ontology
  Decred
  Zcash
Zcash  Lisk
Lisk  Waves
Waves  DigiByte
  Numeraire
  Status
  Nano
Nano  Pax Dollar
  Steem
Steem  OMG Network
  BUSD
BUSD  Ren
Ren  Bytom
Bytom  Bitcoin Diamond
  HUSD
HUSD  Energi
  Augur
Augur