


COMP Technical Analysis: Bearish Influence Over Triangle Adds Pressure

The COMP Technical Analysis displays a bear cycle starting in a symmetrical triangle, giving a short-term selling opportunity. The COMP price action forms a symmetrical triangle pattern in the daily chart with a long-coming support trendline. However, the recent bear cycle starting from the overhead resistance of the resistance trendline comes with a double top pattern. Hence, the possibility of a bearish breakdown of this continuation pattern increases.
Key Points:
- The Compound prices show a bear cycle in the triangle pattern.
- The power struggle at the resistance confluence remains crucial in upcoming trend selection.
- The intraday trading volume in Compound is $94.5 Million.
Source — TradingView
COMP Technical Analysis
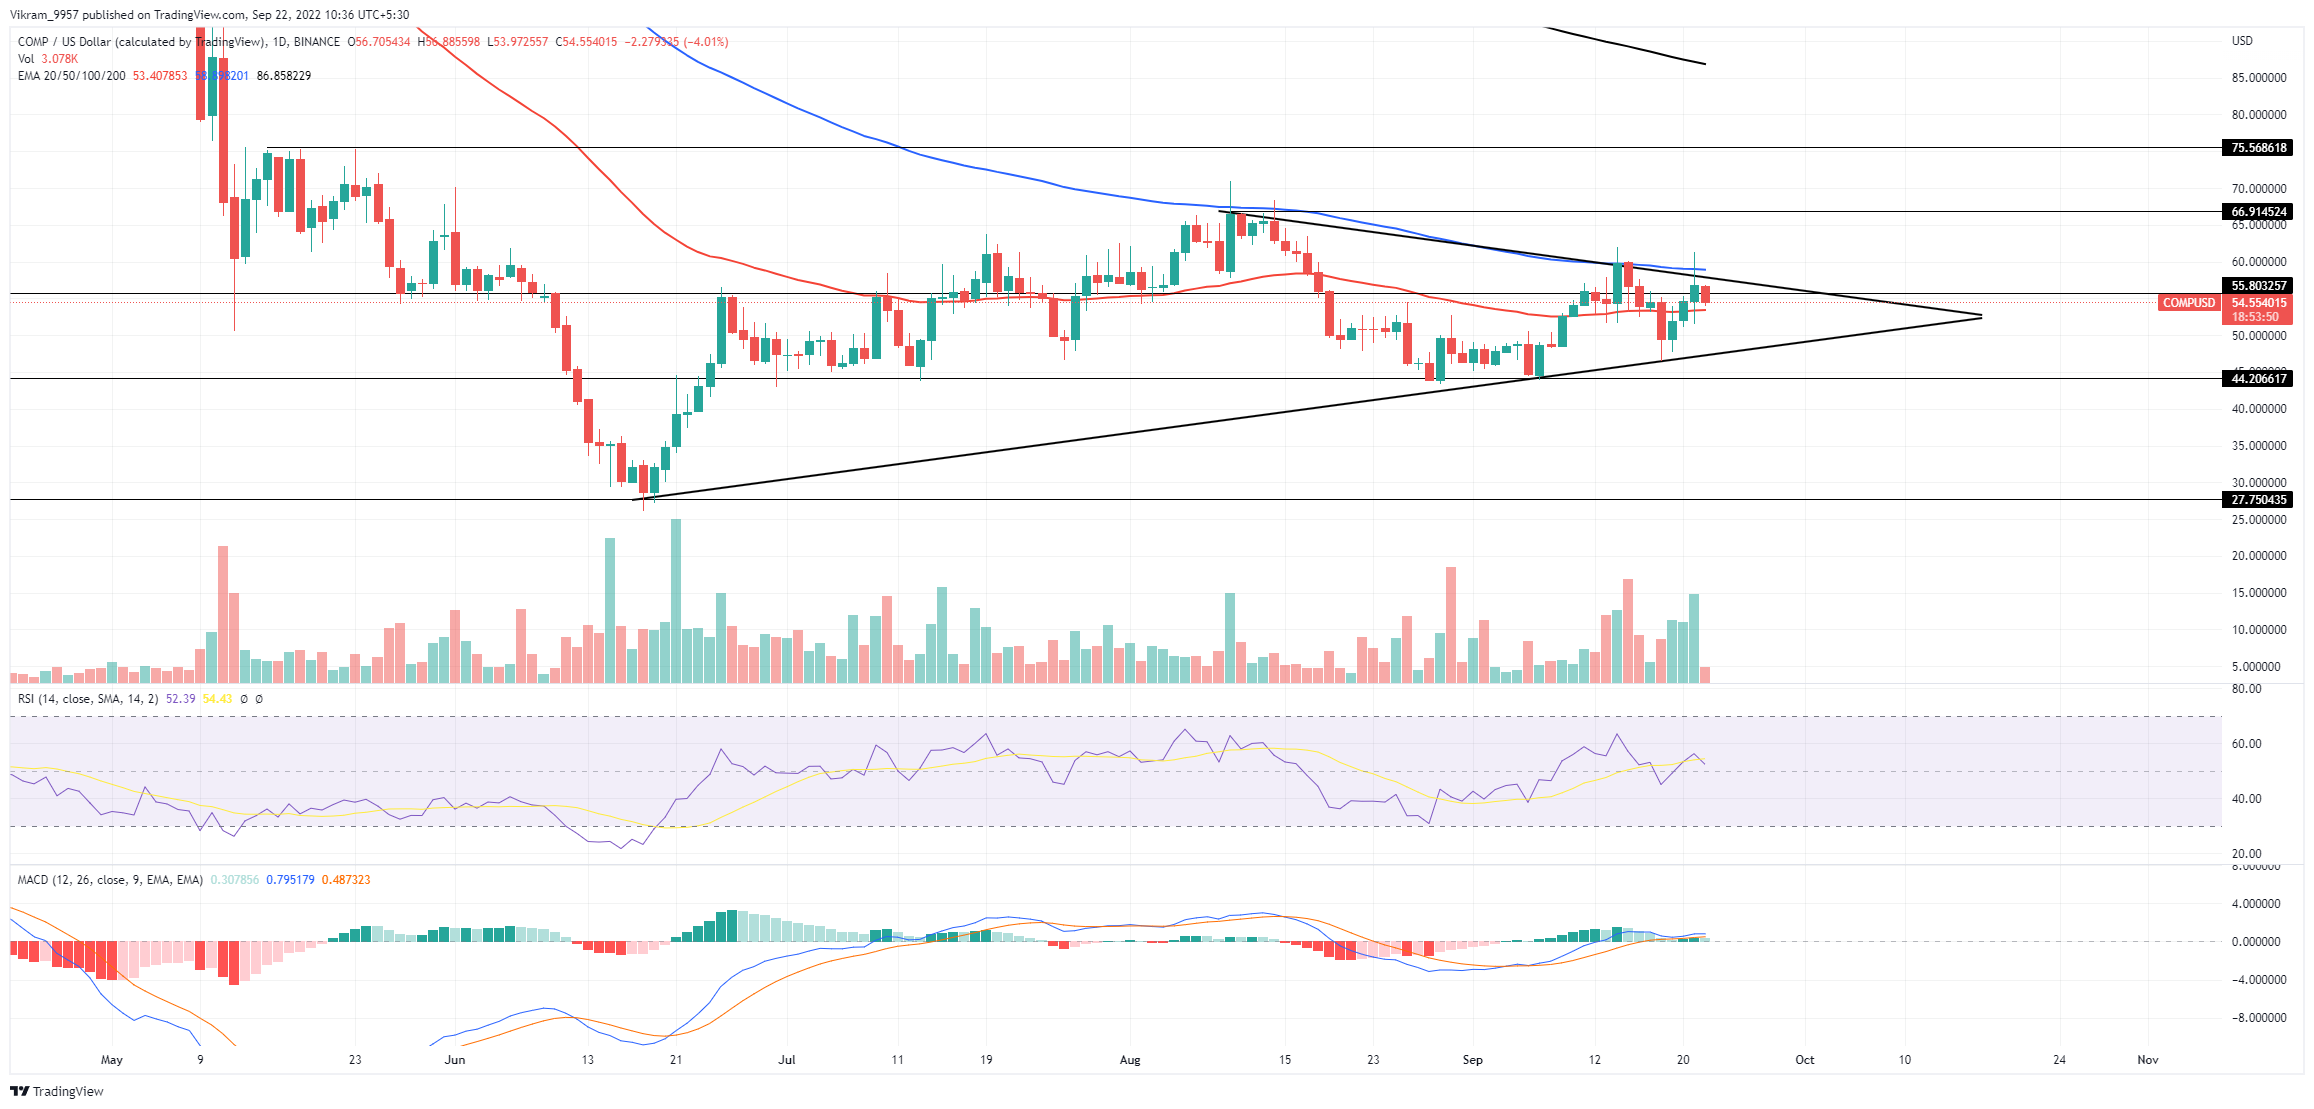
The COMP price takes a bullish reversal from the $27.75 support level to reach the resistance of $66 close to the 100-day EMA last month. However, the increased selling pressure and opposition EMA result in a bearish turnaround with a higher price rejection leading to a symmetrical triangle pattern. After the recent bull cycle, close to the ascending trendline at $44, the buyers reach the 100-day EMA. But the bullish failure leads to a double top pattern and projects that a bear cycle is restarting. The spike in the intraday trading volume coincides with the higher price rejection in the previous daily candle, supporting the possibility of a bearish turnaround. Hence, sideline traders can expect a short-term selling opportunity with the breakout of the 50-day EMA. If the sellers continue to pressurize the price trend, a bearish breakout rally of the triangle may break under $44 to test July’s low of $27. The downtrend will potentially account for a 40% price drop upon the trendline breakout, making it a lucrative selling opportunity. However, if the COMP market value sustains above the 50-day EMA, a bullish turnaround may result in an upside breakout, potentially reaching $66.
Technical Indicators
The lateral movement in the daily-RSI slope mimics the price action and projects the possibility of crossing down the halfway line. However, the midterm uptrend in the RSI starting from the reversal from the oversold boundary highlights a bullish hope. Moreover, the MACD indicator displays a positive trend in the fast and slow lines but struggles to sustain the bullish gap. Hence, a bearish crossover in the fast and slow lines will signal a selling opportunity. Therefore, the technical indicators display a bullish trend struggling to sustain the increased selling pressure. Resistance Levels — $66 and $75 Support Levels — $44 and $27


 Bitcoin
  Ethereum
  Tether
  USDC
USDC  Dogecoin
  Cardano
  Bitcoin Cash
  Polygon
  Litecoin
  LEO Token
  OKB
OKB  Cosmos Hub
  Stellar
  Maker
Maker  Hedera
  Algorand
  NEO
NEO  Synthetix Network
  Gate
Gate  KuCoin
  IOTA
IOTA  Tether Gold
  TrueUSD
  Enjin Coin
  0x Protocol
  Siacoin
  Ravencoin
  Holo
Holo  Basic Attention
  Decred
  Zcash
Zcash  Ontology
  Waves
Waves  DigiByte
  Lisk
Lisk  Numeraire
  Status
  Pax Dollar
  Nano
Nano  Steem
Steem  OMG Network
  BUSD
BUSD  Ren
Ren  Bitcoin Diamond
  Bytom
Bytom  HUSD
HUSD  Energi
  Augur
Augur