


Decred (DCR) Could Fall to New Lows: Biggest Weekly Losers

Be[in]Crypto takes a look at the five cryptocurrencies that decreased the most last week, more specifically, from Sept 2 to Sept 9.
These cryptocurrencies are:
- Nexo (NEXO): – 12.21%
- Chiliz (CHZ): -10.46%
- UNUS SED LEO (LEO): -7.90%
- 1inch Network (1INCH): -5.79%
- Decred (DCR): -4.47%
NEXO
NEXO has been moving upwards since June 18. The price broke out from a descending resistance line on Aug 10. After validating it as support two days later, the price continued its upward movement and reached a high of $1.25 on Aug 31.
NEXO has been falling since, after it was rejected by the $1.20 resistance area (red icon). So, despite the breakout, the trend cannot be considered bullish until NEXO manages to break out from this resistance area.
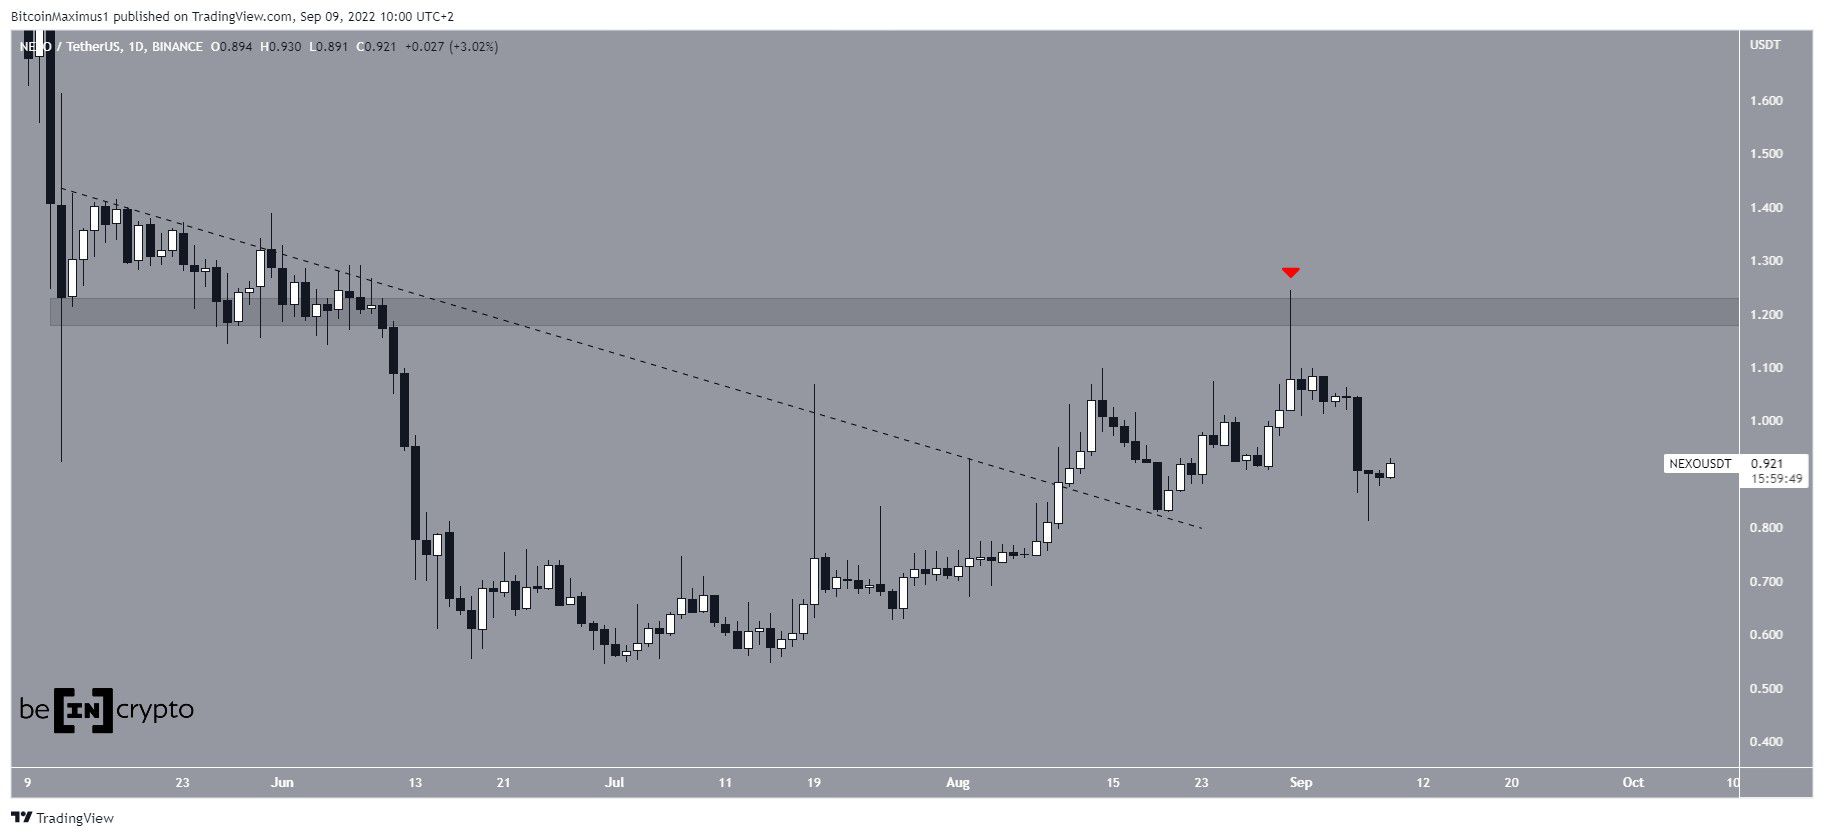
NEXO/USDT Chart By TradingView
CHZ
CHZ has been falling since reaching a high of $0.26 on Aug 24. The downward movement took it to a low of $0.182 on Sept 7. Afterward, the price bounced at the $0.185 horizontal support area.
It is possible that the preceding increase is a five-wave upward movement, and the current decrease is an A-B-C corrective structure. In this possibility, CHZ will resume its upward movement towards new highs.
A breakout from the resistance line will confirm that this is the correct count.
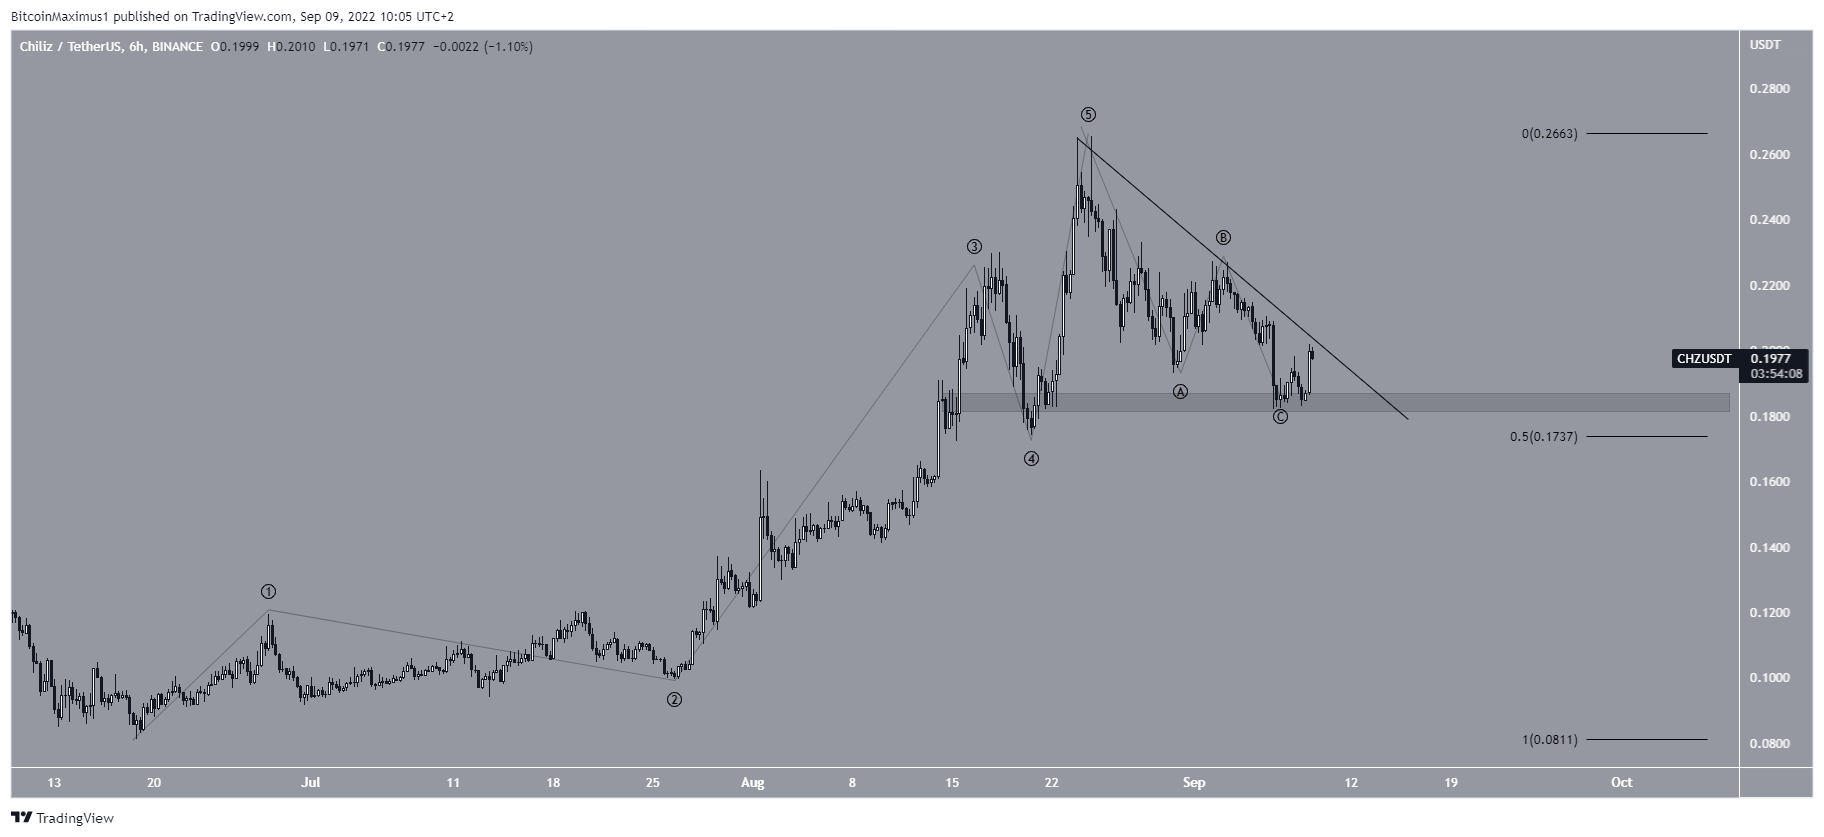
CHZ/USDT Chart By TradingView
LEO
LEO has been decreasing inside a descending wedge since reaching a high of $8.14 on Feb 8. More recently, it was rejected by the resistance line of the wedge on Sept 1.
While technical indicators are neutral, since the RSI is right at the 50 line, the fact that the descending wedge is considered a bullish pattern makes the possibility of a breakout more likely.
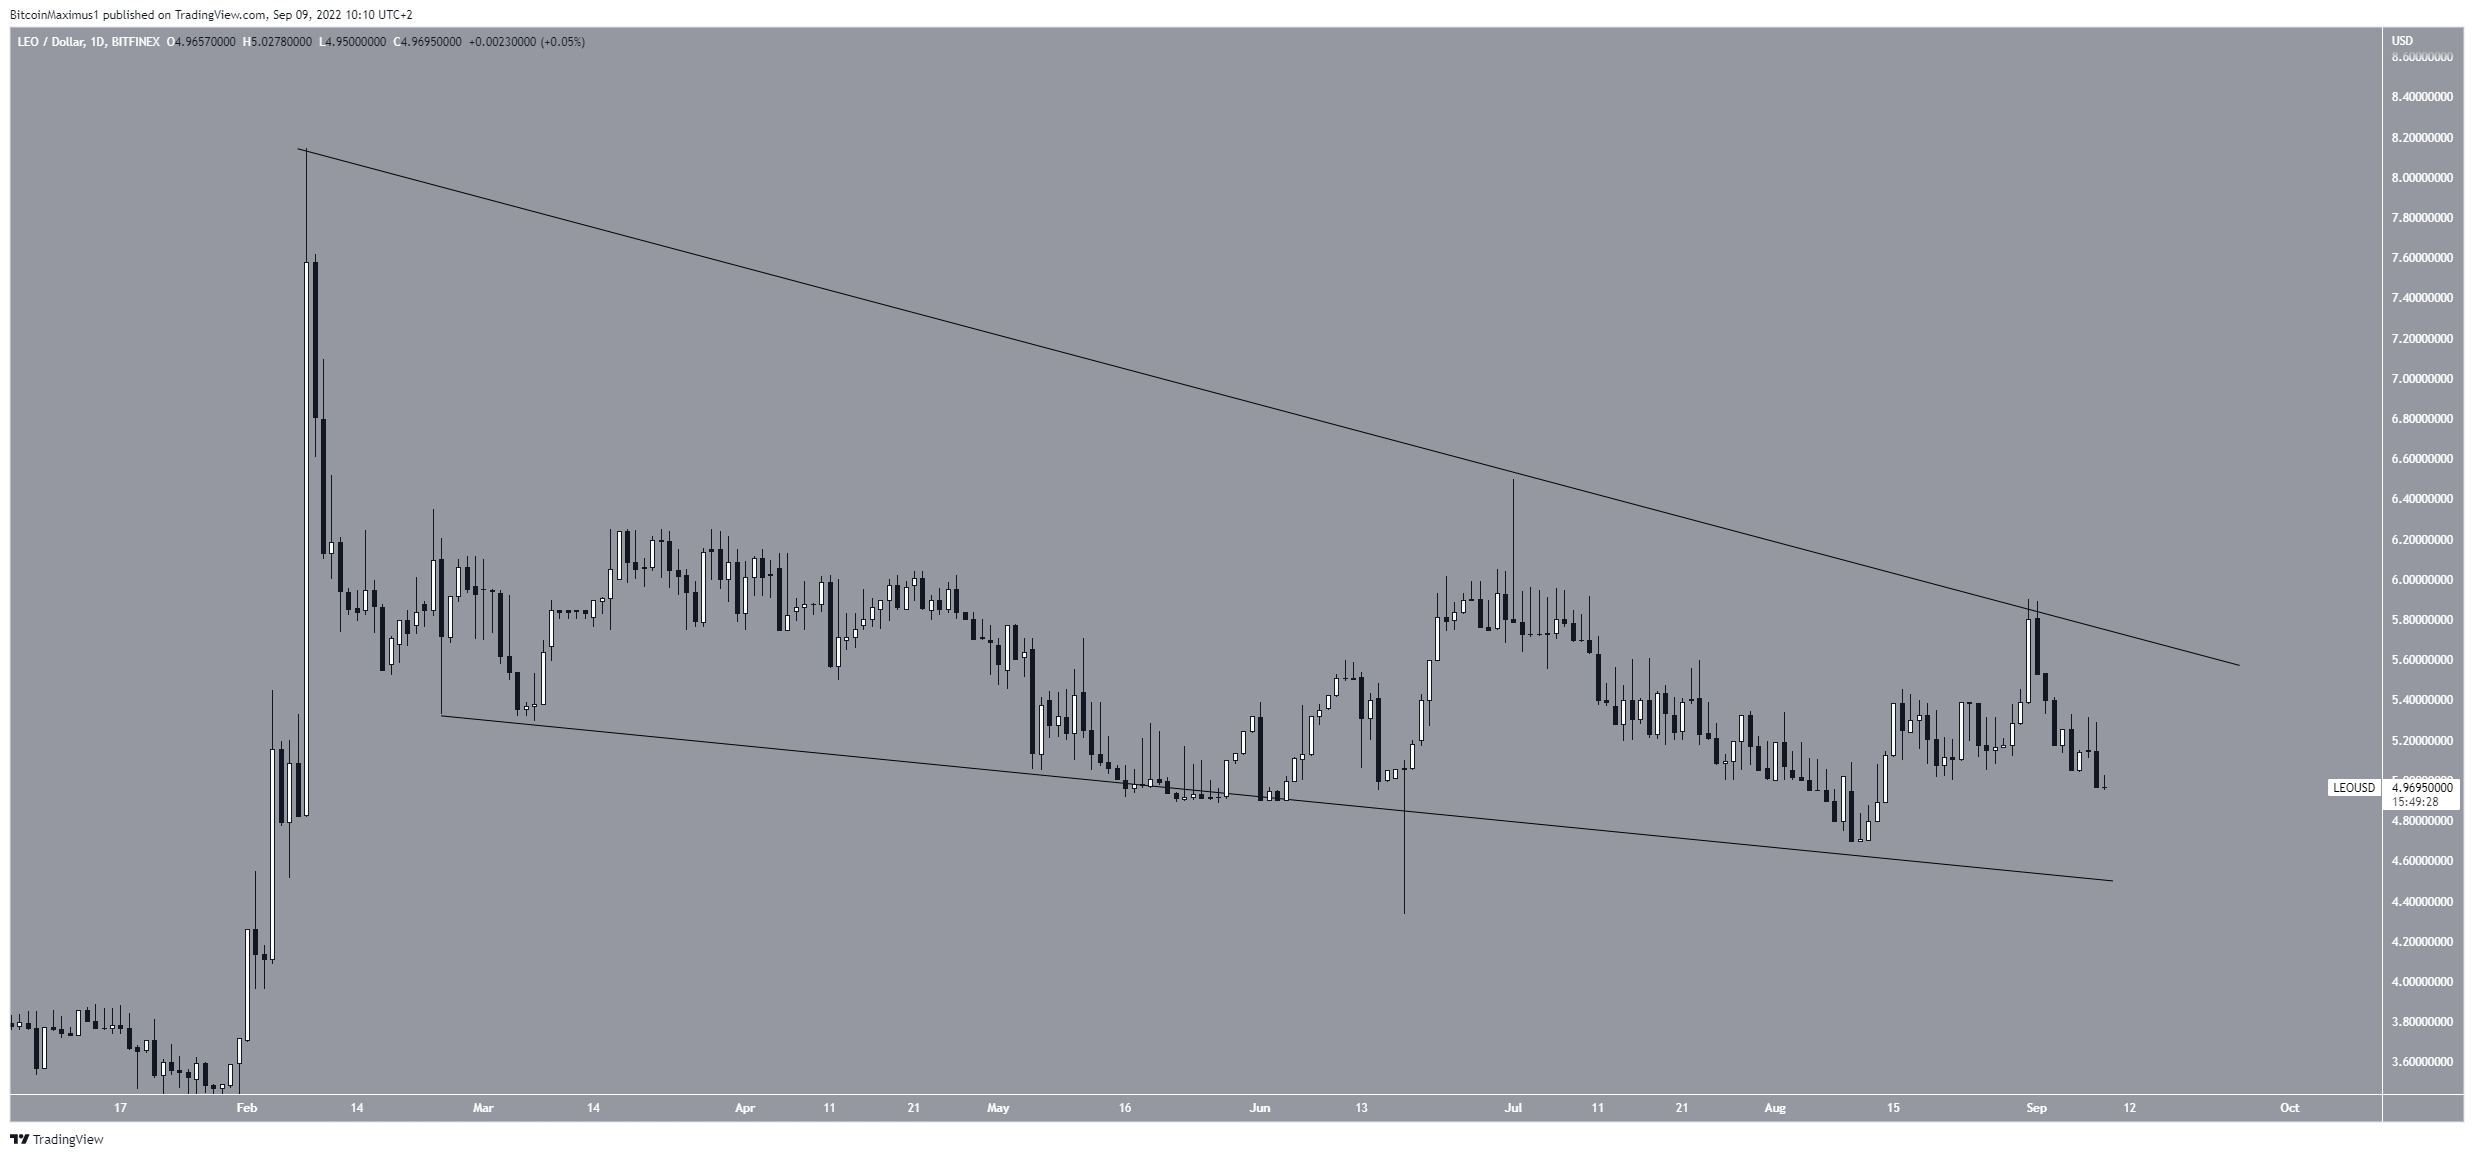
LEO/USD Chart By TradingView
1INCH
1INCH has been increasing alongside an ascending support line since June 18. The line has been validated numerous times, most recently on Sept 7.
Over the past two weeks, the RSI has generated a significant amount of bullish divergence (green line). So, it is likely that this divergence will be the catalyst for an upward movement towards the closest resistance at $0.71 to $0.75.
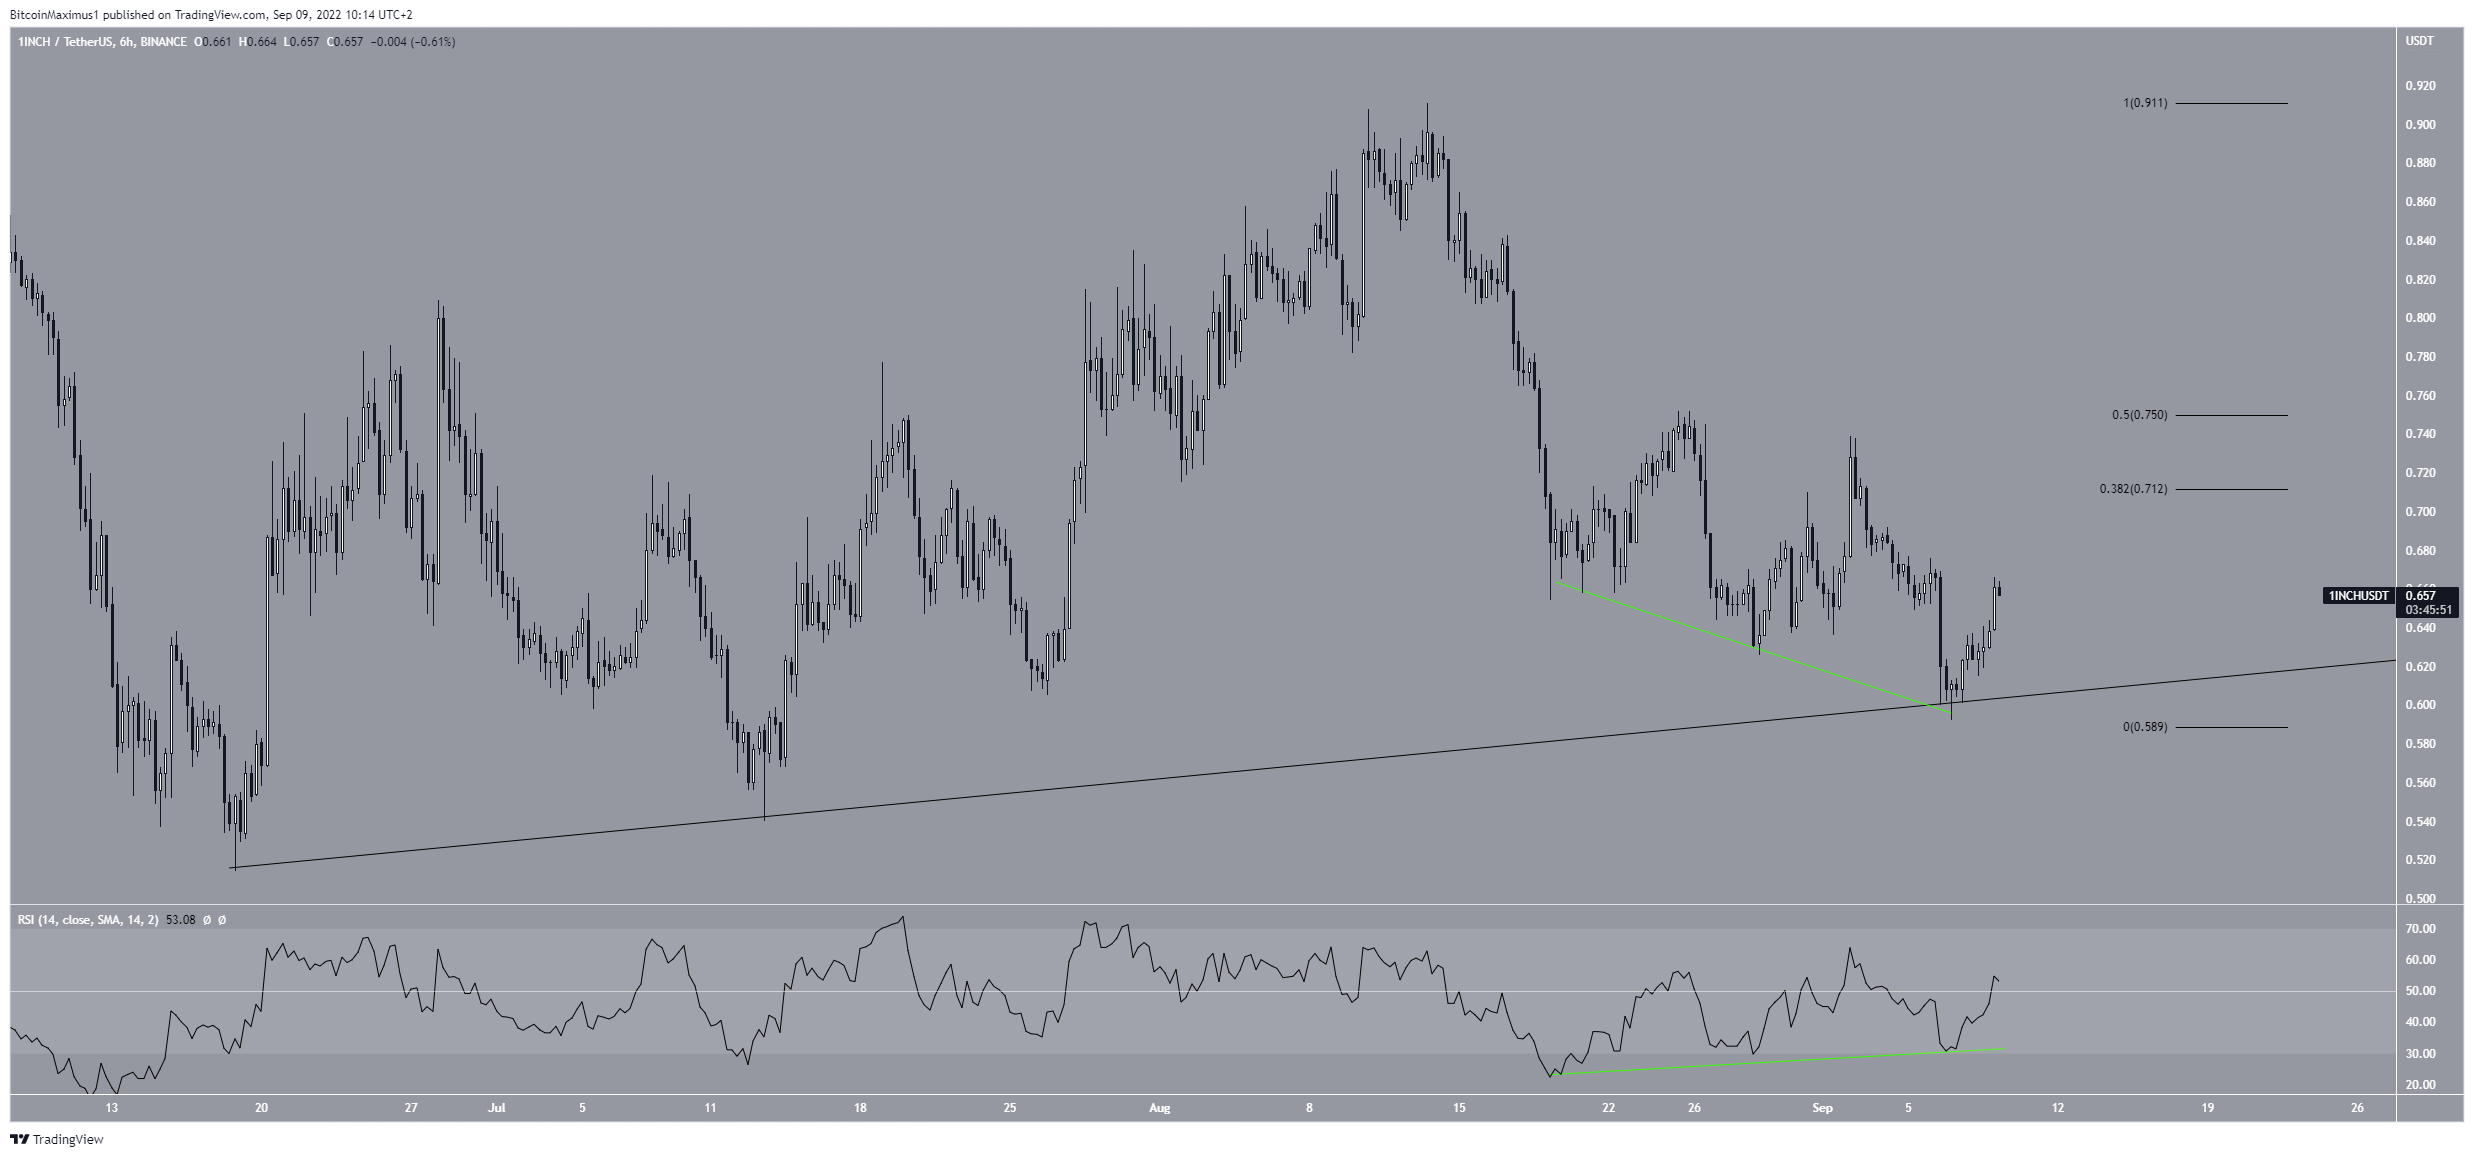
1INCH/USDT Chart By TradingView
DCR
DCR has been falling underneath a descending resistance line since Dec 2021. The line has caused numerous rejections, most recently doing so on Aug 5 (red icon). Currently, DCR is holding on above the $28 horizontal support area.
A breakdown below it would likely take DCR towards new lows.
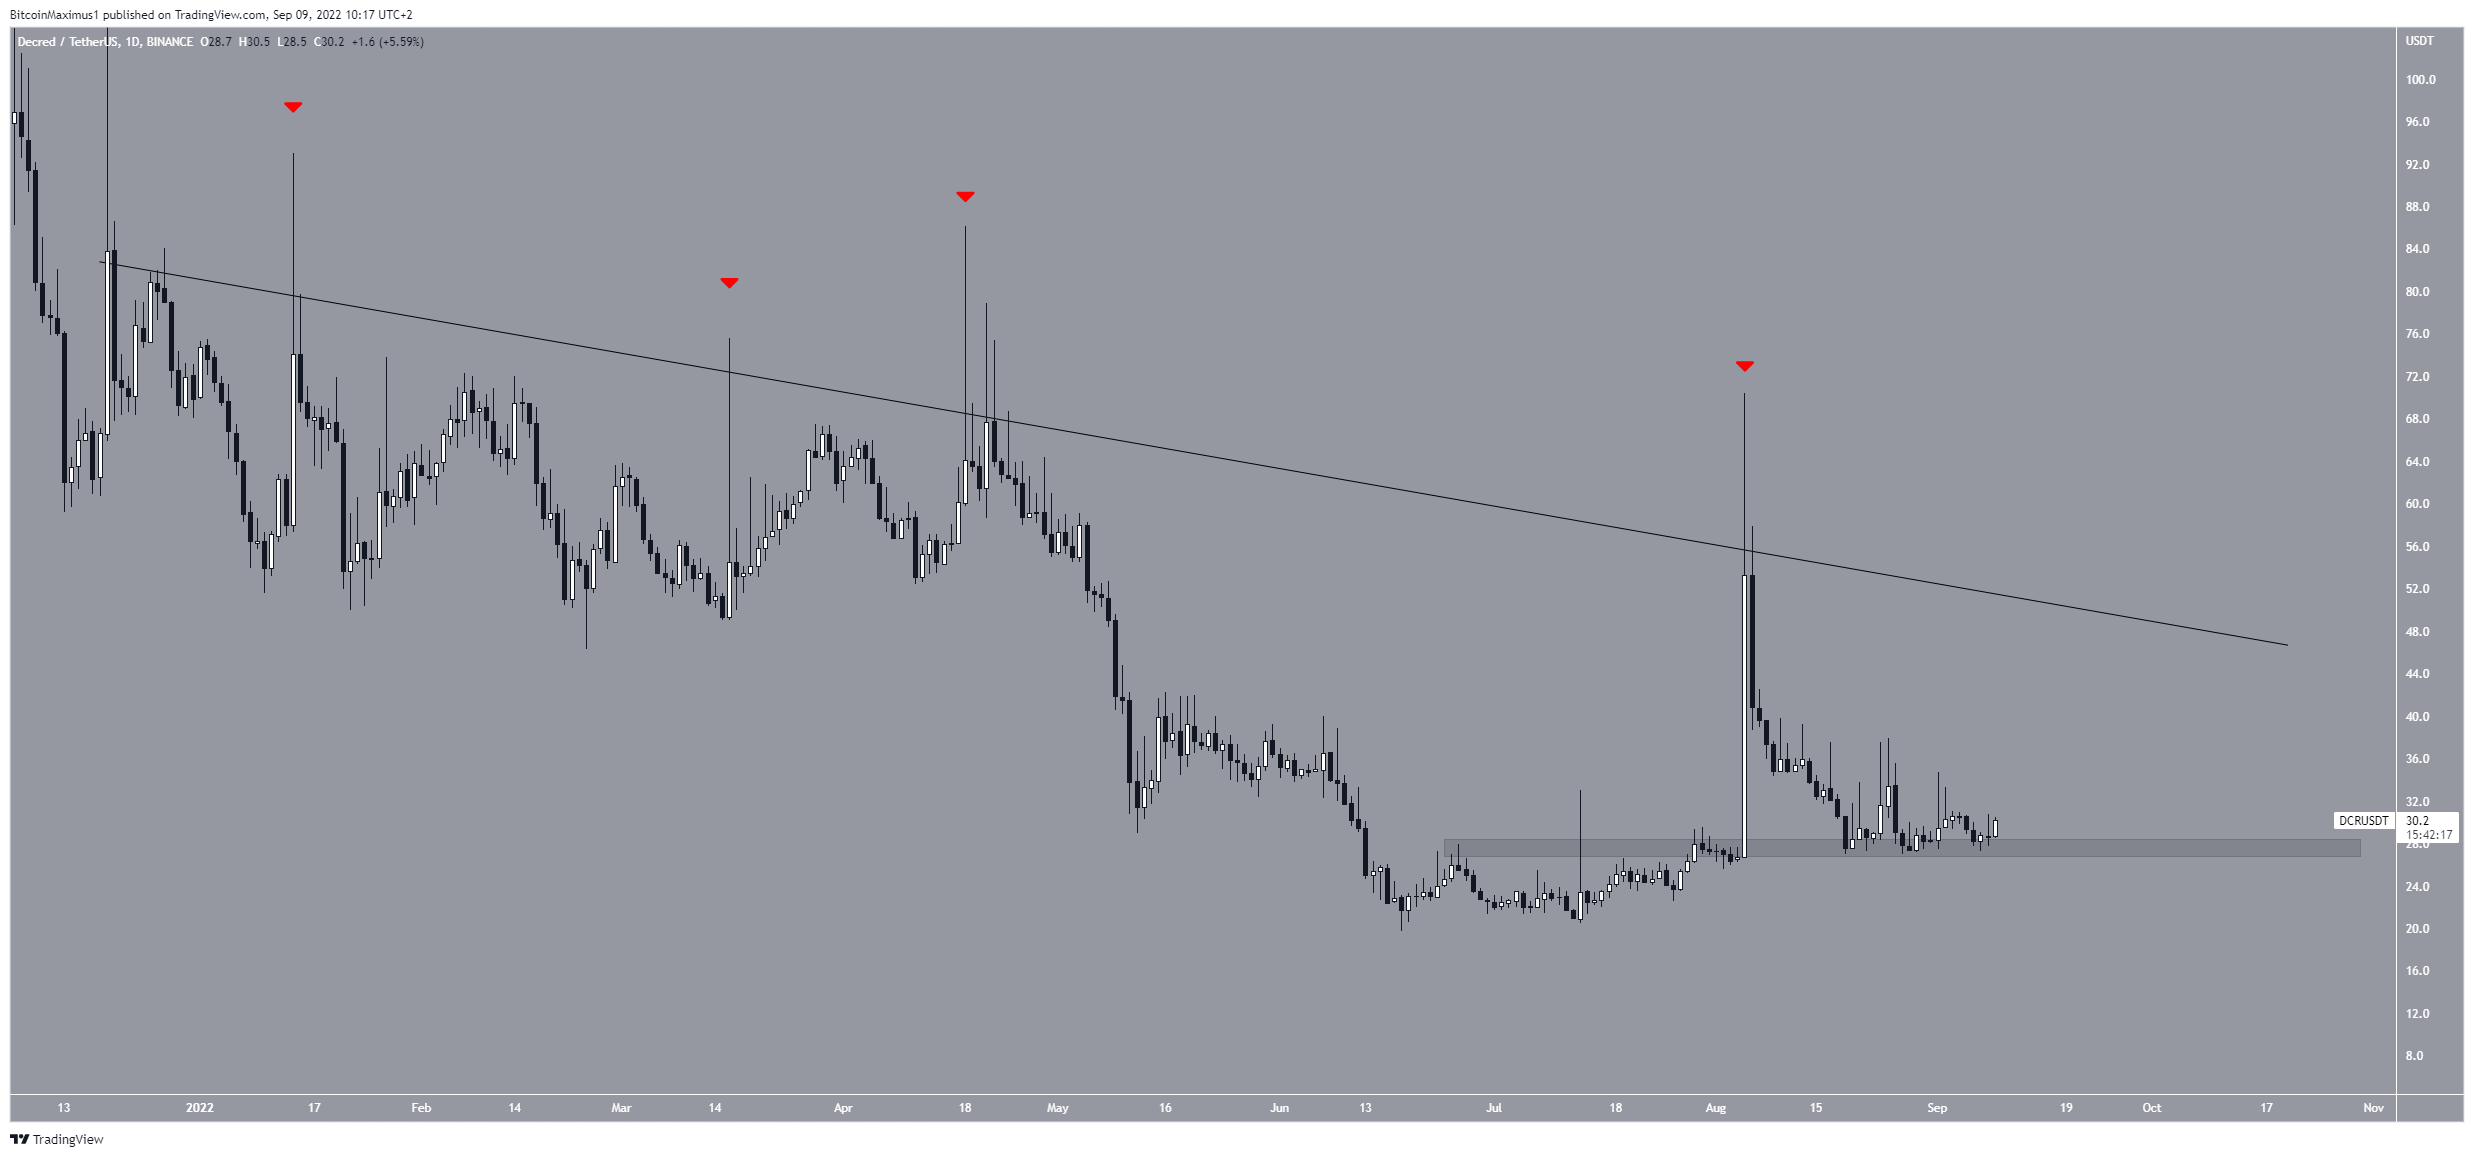
DCR/USDT Chart By TradingView
For Be[in]Crypto’s latest Bitcoin (BTC) analysis, click here


 Bitcoin
  Ethereum
  Tether
  USDC
USDC  Dogecoin
  Cardano
  Bitcoin Cash
  Polygon
  Litecoin
  LEO Token
  OKB
OKB  Stellar
  Cosmos Hub
  Hedera
  Maker
Maker  Algorand
  NEO
NEO  Synthetix Network
  Gate
Gate  KuCoin
  IOTA
IOTA  Tether Gold
  TrueUSD
  Enjin Coin
  0x Protocol
  Ravencoin
  Holo
Holo  Siacoin
  Basic Attention
  Ontology
  Decred
  Zcash
Zcash  Lisk
Lisk  Waves
Waves  DigiByte
  Numeraire
  Status
  Nano
Nano  Pax Dollar
  Steem
Steem  OMG Network
  BUSD
BUSD  Ren
Ren  Bitcoin Diamond
  Bytom
Bytom  HUSD
HUSD  Energi
  Augur
Augur