


DOT Technical Analysis: Downtrend Halts At 50-day EMA

The DOT price action shows a bearish breakout rally resting at the 50-day EMA, ready to gain momentum and test the $6.55 mark.
Key Technical Points:
- The Polkadot price has dropped by 13% in the last week.
- The price actions show a bearish breakout of a rising wedge pattern.
- With a market cap of $9.377 billion, the intraday trading volume of Polkadot has increased by 16% to reach $459 million.
Past Performance of DOT
As we mentioned in our previous analysis, the DOT prices retest the $8.75 mark, but the downtrend continues instead of a bullish reversal. Currently, resting at the 50-day EMA, the prices sustain above $8, avoiding a drop to the $6.55 support level. Moreover, the higher price rejection in the daily candles retests the broken resistance trendline.
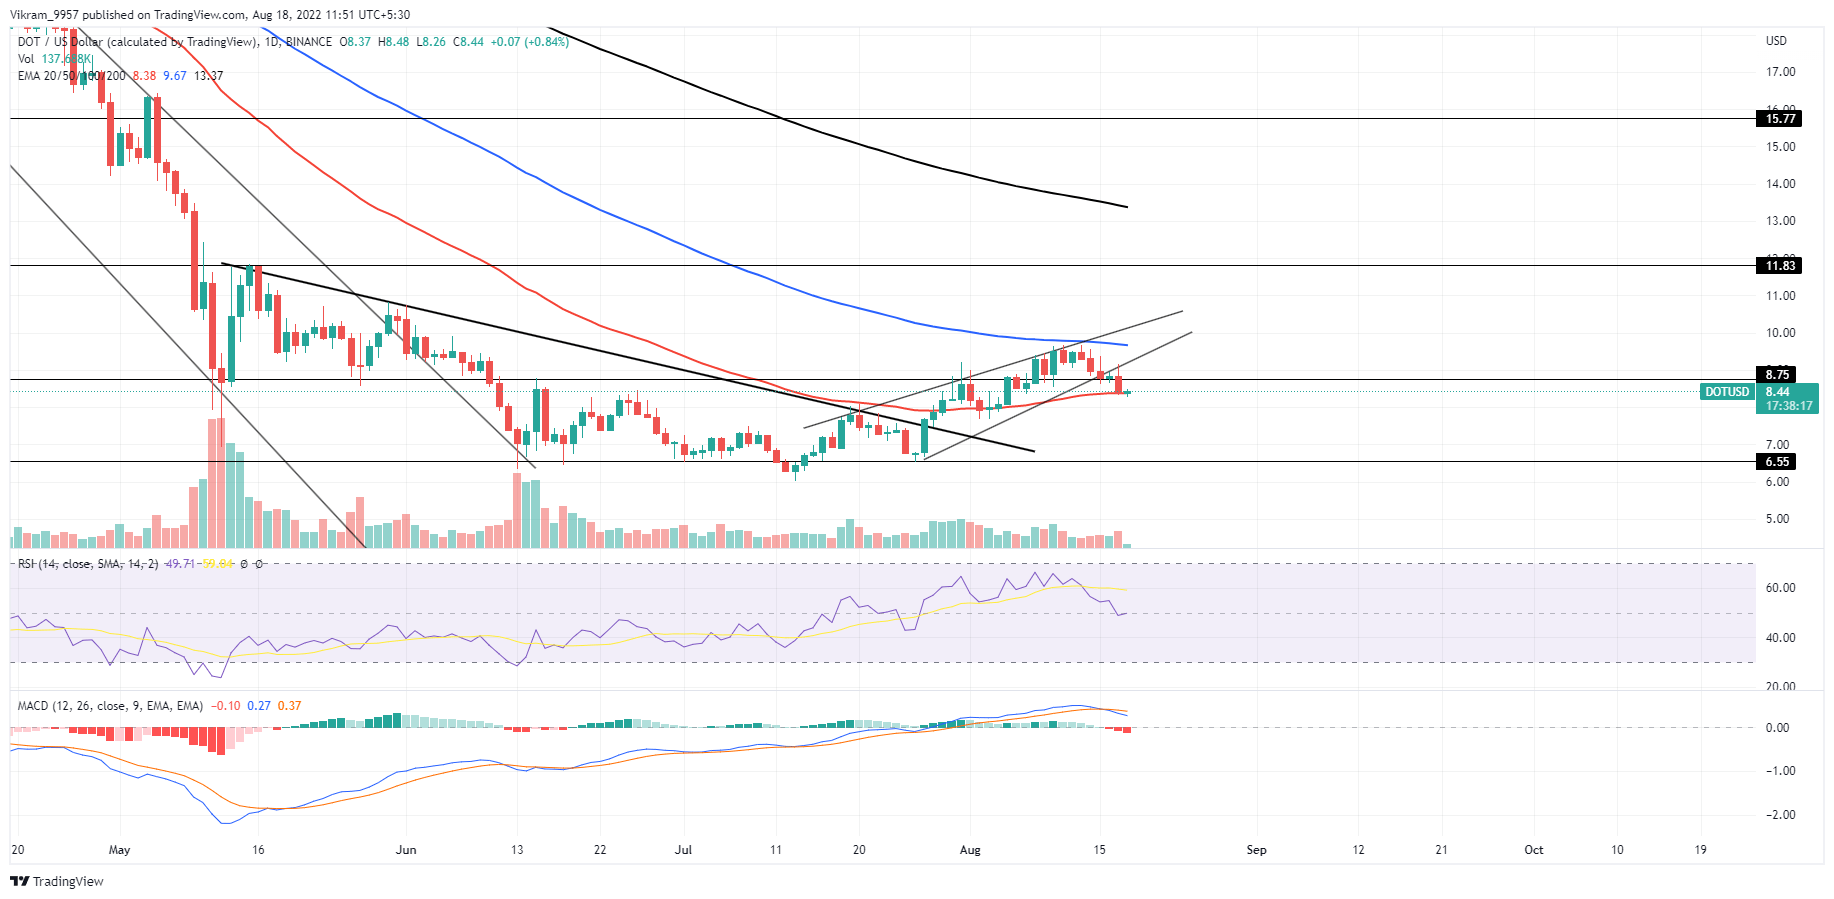
Source — Tradingview
DOT Technical Analysis
The DOT price action reflects an increase in the underlying bearishness as the selling pressure increases, evident by the spike in trading volume. Hence the possibility of a 50-day EMA breakout increases to test the bottom support at $6.55. After the recent sideways shift into EMAs, the downfall restarts the bearish influence over the EMA. The daily RSI slope drops below the 14-day average line and tests the halfway line support reflecting an increase in underlying bearishness. Moreover, the MACD indicator forecasts a downtrend continuation, with the recent bearish crossover of the fast and slow lines. Hence the technical indicators support the bearish price action analysis. In a nutshell, the DOT Technical Analysis displays a high possibility of a price drop below the 50-day EMA.
Upcoming Trend
DOT prices will decrease below the 50-day EMA to reach the $6.55 mark. On the contrary, a reversal from the 50-day EMA will test the 100-day EMA near the $9 mark. Resistance Levels: $9 and $10 Support Levels: $8 and $6.55


 Bitcoin
  Ethereum
  Tether
  USDC
USDC  Dogecoin
  Cardano
  Bitcoin Cash
  Polygon
  Litecoin
  LEO Token
  OKB
OKB  Stellar
  Cosmos Hub
  Hedera
  Maker
Maker  Algorand
  NEO
NEO  Synthetix Network
  Gate
Gate  KuCoin
  IOTA
IOTA  Tether Gold
  TrueUSD
  Enjin Coin
  0x Protocol
  Ravencoin
  Holo
Holo  Siacoin
  Basic Attention
  Ontology
  Decred
  Zcash
Zcash  Lisk
Lisk  Waves
Waves  DigiByte
  Numeraire
  Status
  Nano
Nano  Pax Dollar
  Steem
Steem  OMG Network
  BUSD
BUSD  Ren
Ren  Bitcoin Diamond
  Bytom
Bytom  HUSD
HUSD  Energi
  Augur
Augur