


FTX Token (FTT) Price Pumps 12% Following Major Acquisition

FTX Token (FTT) has been moving upwards over the past two days. The price could soon confirm a long-term bullish reversal.
The price of FTX Token (FTT), the native token of the FTX exchange began an upward movement on news of the exchange’s acquisition of bankrupt digital lender Voyager’s assets for $1.42 billion.
All signs point to breakout from long-term resistance
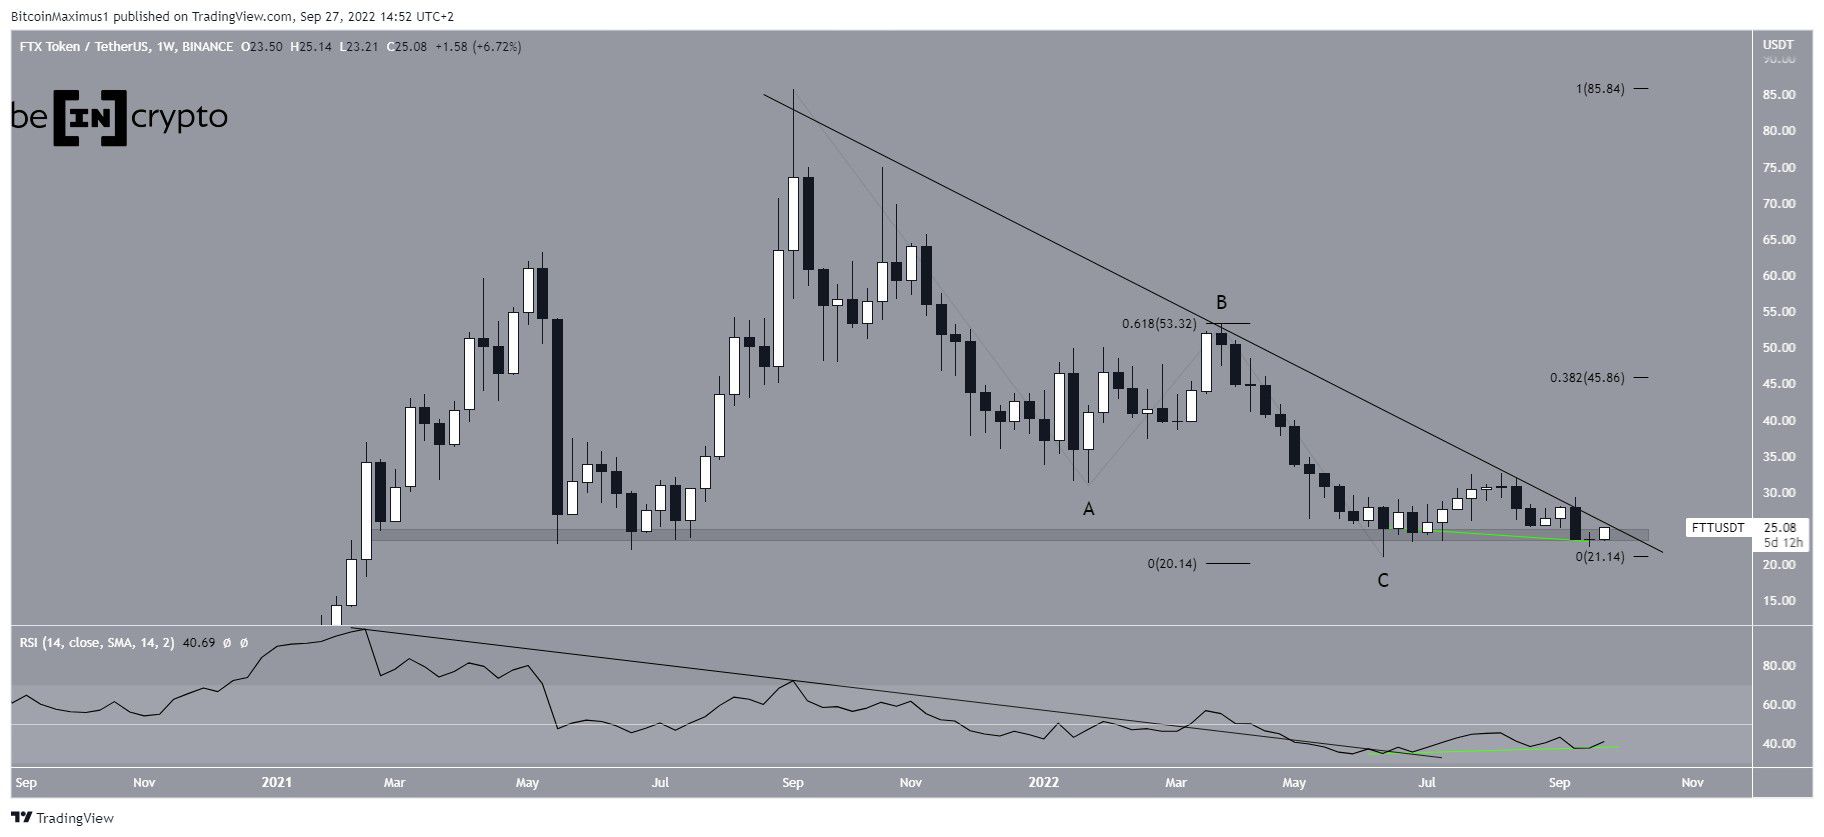
FTT has been falling underneath a descending resistance line since reaching an all-time high price of $85.74 in Sept. 2021. However, the weekly chart is decisively bullish for several reasons.
Firstly, the price has created a double bottom inside the $24 horizontal support area. The double bottom is considered a bullish pattern, meaning that it leads to breakouts the majority of the time.
Secondly, the pattern has been combined with bullish divergence in the RSI (green line) Such divergences in the weekly time frame often lead to significant upward movements. Additionally, the RSI has broken out from its bearish divergence trend line (black).
Finally, FTT seems to have completed an A-B-C corrective structure, in which waves A:C have had an exactly 1:0.618 ratio. This is the second most common ratio in such corrections.
Therefore, all signs point to an eventual breakout from the long-term descending resistance line. If one occurs, the closest resistance area would be at $46, created by the 0.382 Fib retracement resistance level.
FTT/USDT Chart By TradingView
Daily chart also looking bullish
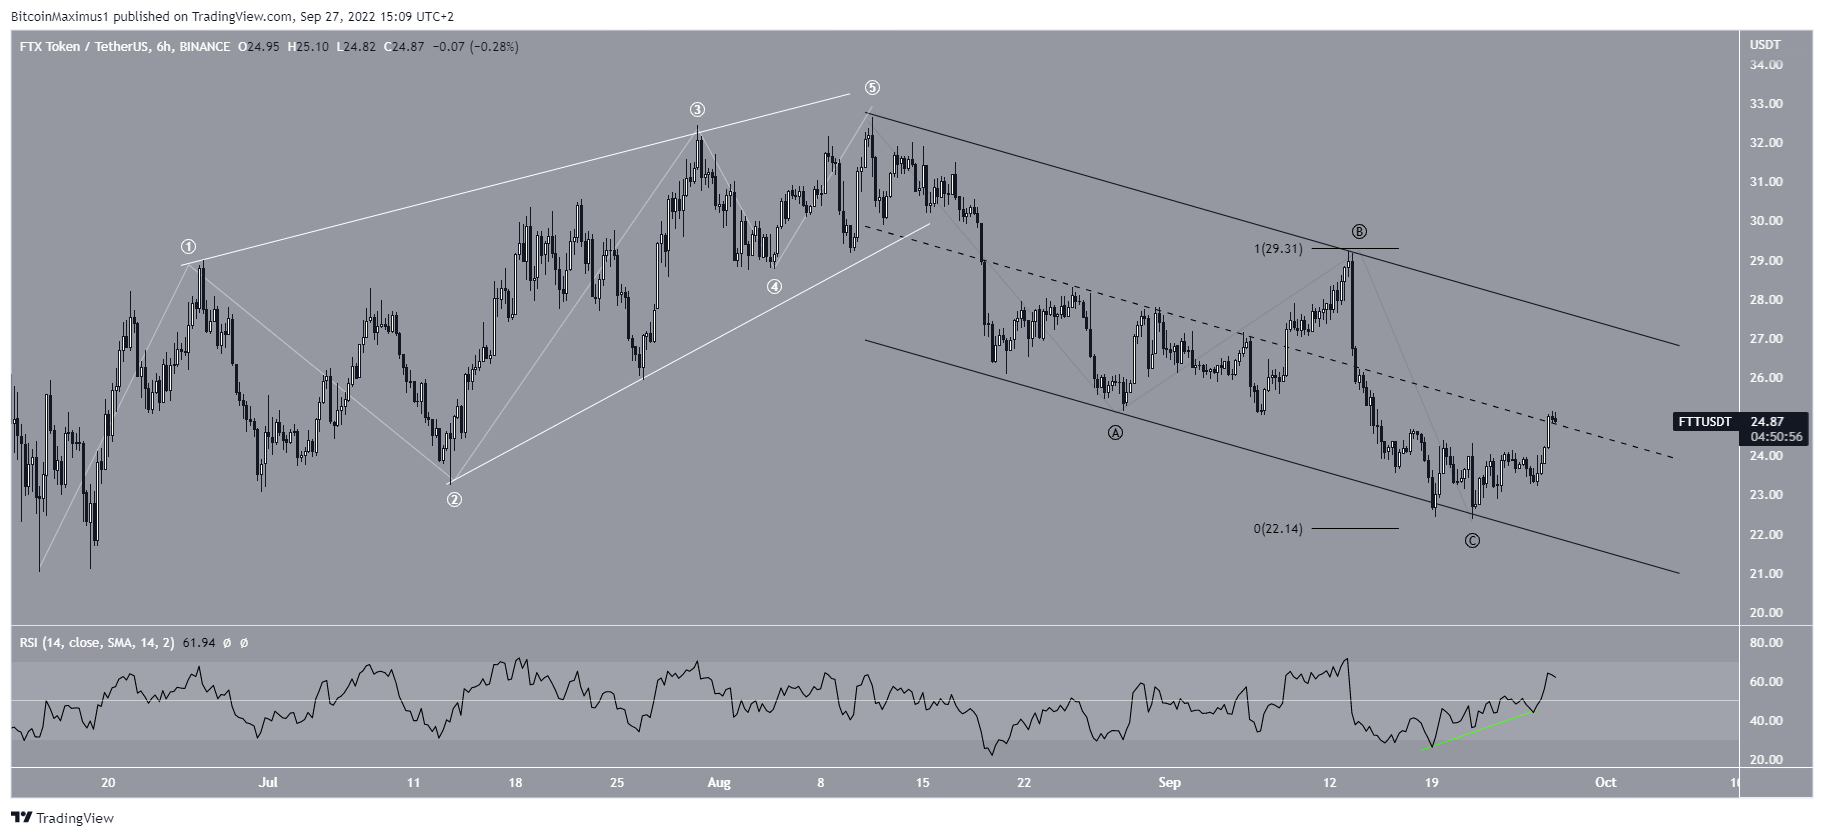
The daily chart supports the findings from the weekly one. Measuring from the June bottom, it shows that the price has completed a five-wave upward movement, which took the shape of a leading diagonal.
Since then, it seems to have completed an A-B-C correction structure, in which waves A:C have had a nearly 1:1 ratio. The fact that the movement has been contained inside a descending parallel channel and the bullish divergence in the RSI (green line) support this possibility.
FTT/USDT Chart By TradingView


 Bitcoin
  Ethereum
  Tether
  USDC
USDC  Dogecoin
  Cardano
  Bitcoin Cash
  Polygon
  Litecoin
  LEO Token
  OKB
OKB  Stellar
  Cosmos Hub
  Hedera
  Maker
Maker  Algorand
  NEO
NEO  Synthetix Network
  Gate
Gate  KuCoin
  IOTA
IOTA  Tether Gold
  TrueUSD
  Enjin Coin
  0x Protocol
  Ravencoin
  Holo
Holo  Siacoin
  Basic Attention
  Ontology
  Decred
  Zcash
Zcash  Lisk
Lisk  Waves
Waves  DigiByte
  Numeraire
  Status
  Nano
Nano  Pax Dollar
  Steem
Steem  OMG Network
  BUSD
BUSD  Ren
Ren  Bitcoin Diamond
  Bytom
Bytom  HUSD
HUSD  Energi
  Augur
Augur