


Helium (HNT) Falls to New Yearly Low: Biggest Weekly Losers

Be[in]Crypto takes a look at the five cryptocurrencies that decreased the most last week, more specifically, from Aug 19 to 26.
These cryptocurrencies are:
- Gnosis (GNO) : – 10.65%
- Flow (FLOW): -9.81%
- OKB (OKB): -9.65%
- Filecoin (FIL): -7.87%
- Helium (HNT): -7.04%
GNO
GNO had been increasing alongside an ascending support line since July 14. This upward movement led to a high of $205.50 on Aug 18. However, the price was rejected by the $195 horizontal area and has been decreasing since. On Aug 20, it broke down from the ascending support line.
If the downward movement continues, the closest support area would be at $140, created by a horizontal level and the resistance line of the previous ascending parallel channel.
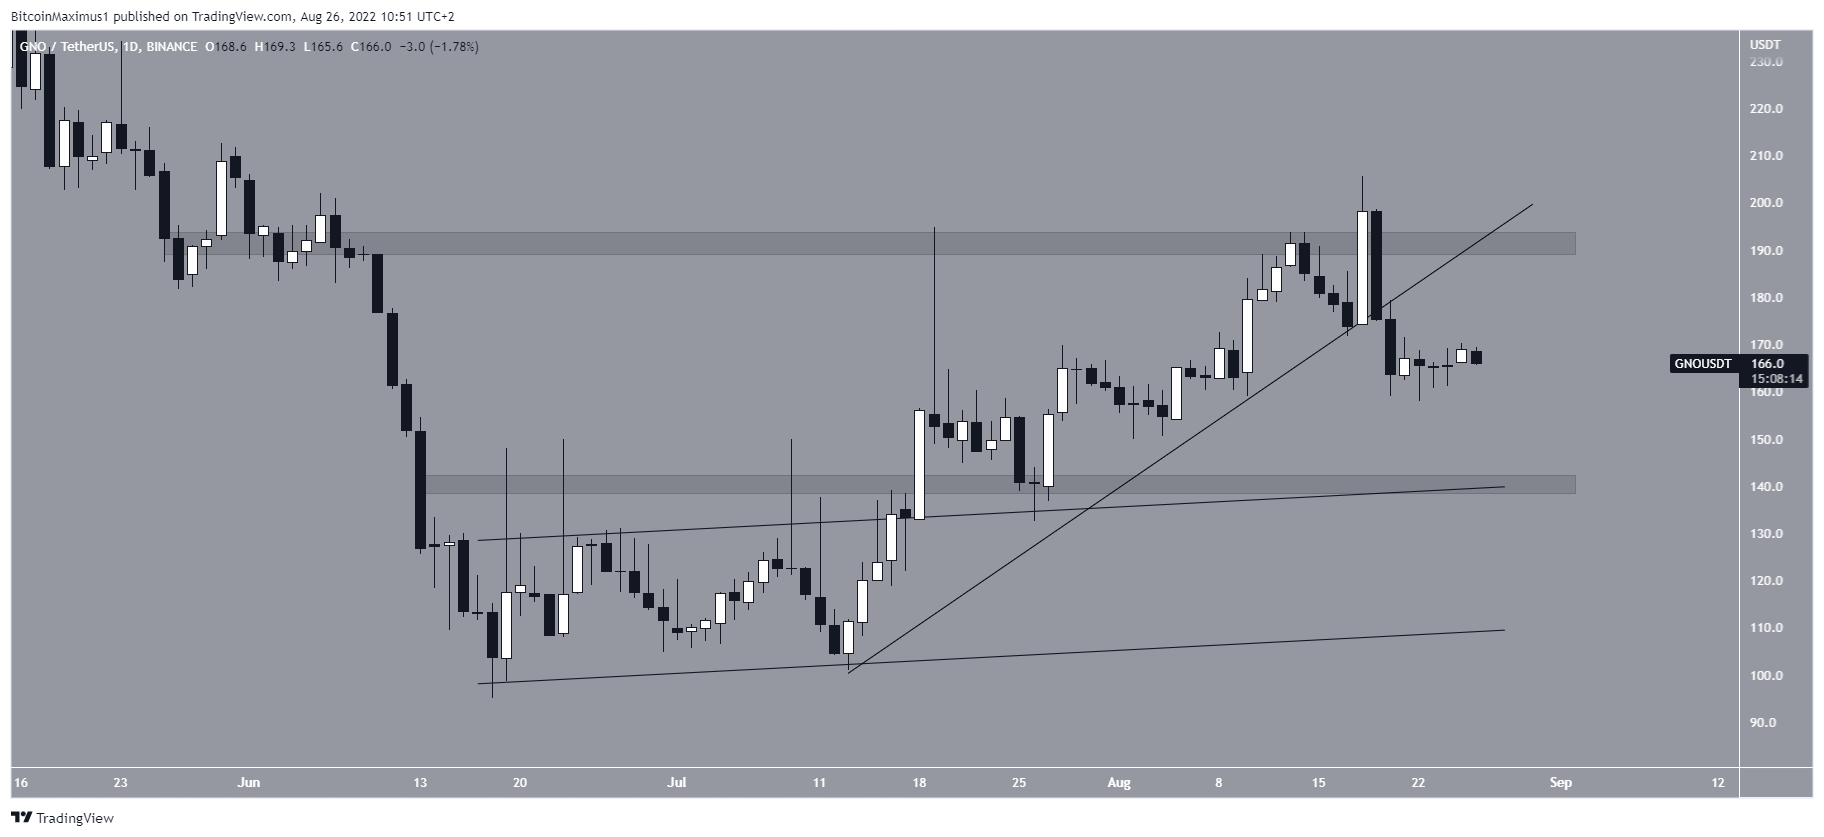
GNO/USDT Chart By TradingView
FLOW
FLOW had been increasing inside an ascending parallel channel since June 18. On Aug 4, it broke out from the channel and proceeded to reach a high of $3.25. However, it was rejected by the $3.20 horizontal resistance area (red icon) and has been falling since.
Currently, it is back in the middle of the previous channel. It is possible that the decrease is part of a fourth-wave pullback. In order for this to hold true, FLOW has to continue trading above the middle of this channel.
Conversely, a breakdown from this channel would be expected to lead to lower prices.
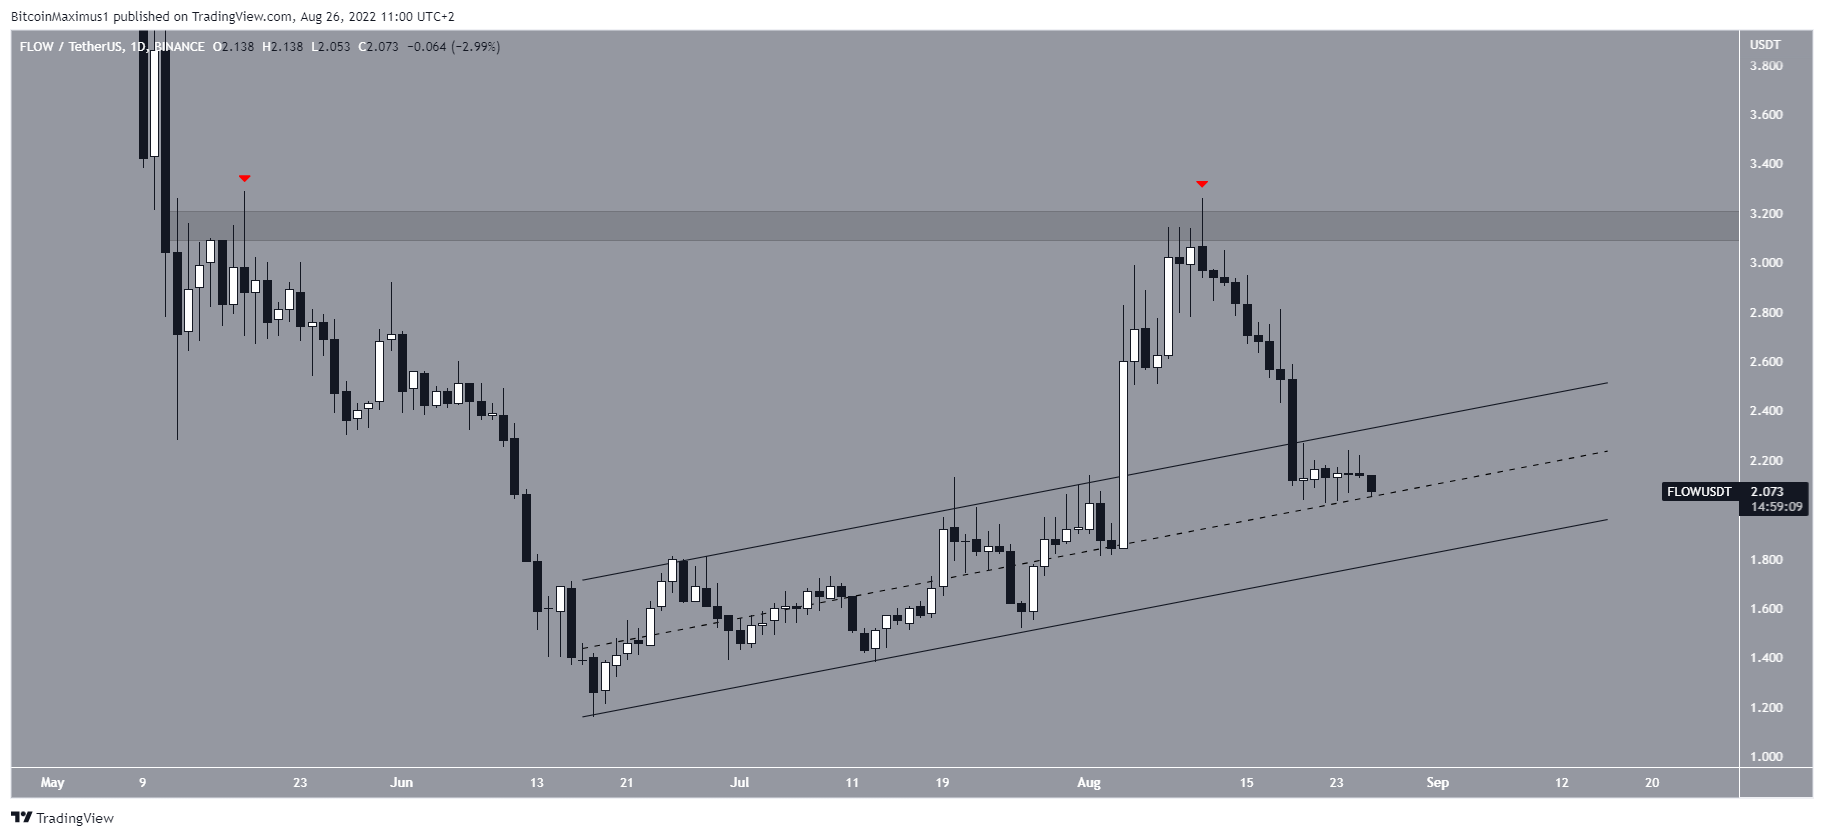
FLOW/USDT Chart By TradingView
OKB
OKB has been moving upward since June 18. The increase resembles a five-wave upward movement and led to a high of $23 on Aug 14. OKB has been moving downward since.
It is possible that OKB has begun an A-B-C corrective structure. If so, the 0.5-0.618 Fib retracement support area at $14.75 to $16.30 would be expected to act as the bottom.
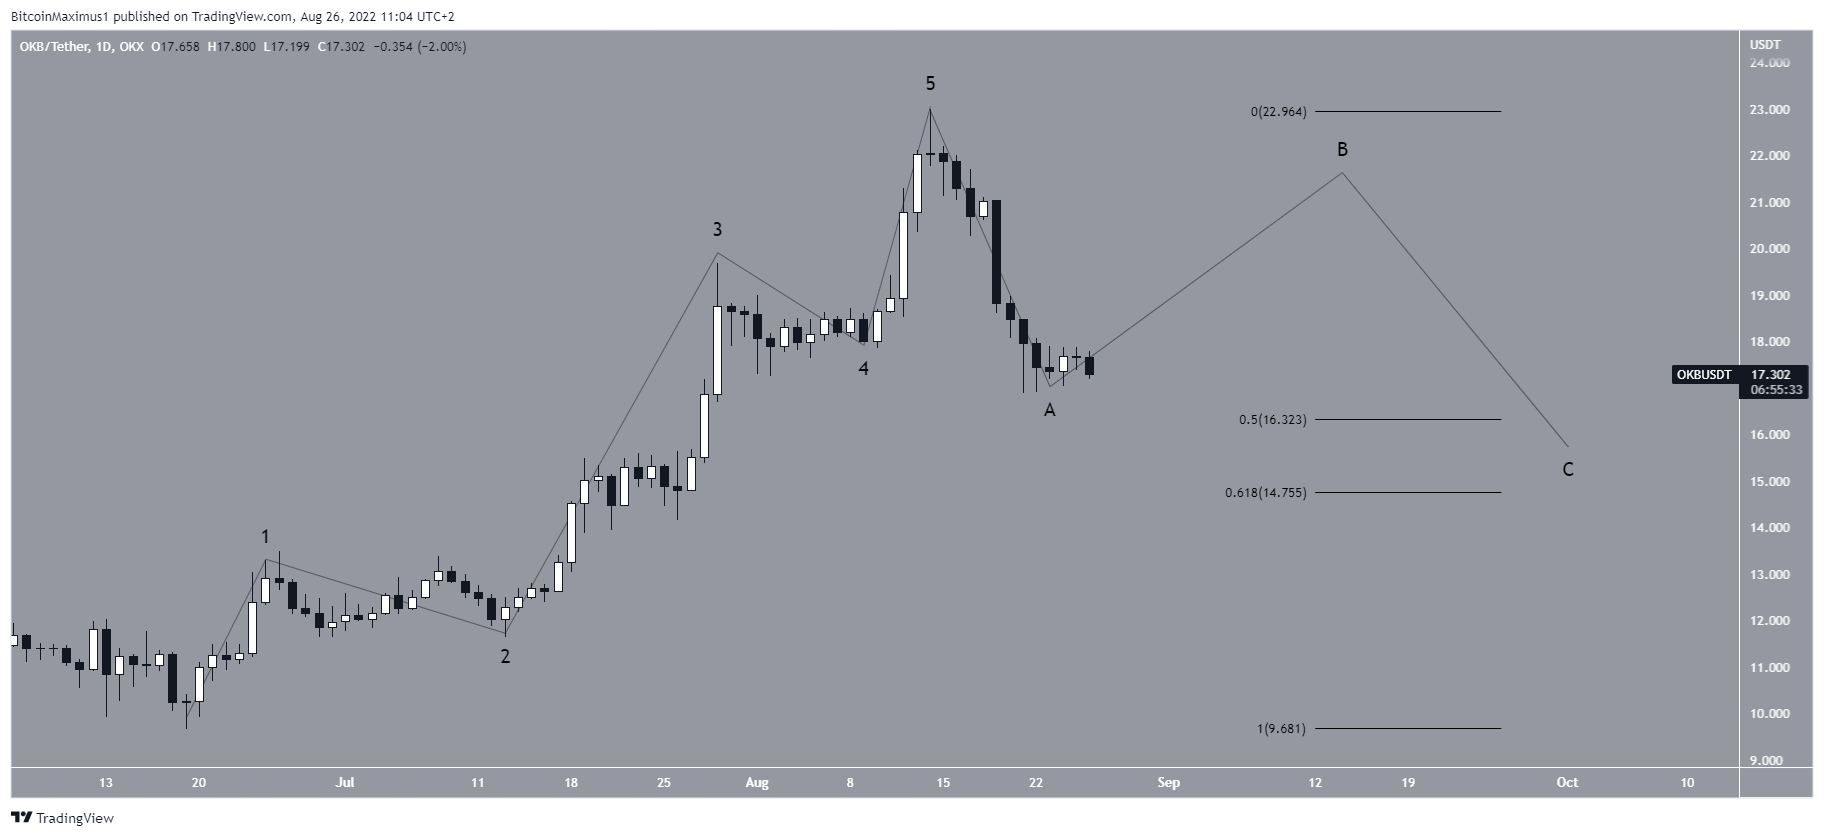
OKB/USDT Chart By TradingView
FIL
FIL has been falling since Aug 1, when it was rejected by the $11.20 horizontal resistance area (red icon). The rejection and ensuing decrease created a very long upper wick, which is considered a sign of selling pressure.
FIL has now returned to the $6.05 horizontal support area. A breakdown from this area would be expected to take the price below its June lows.
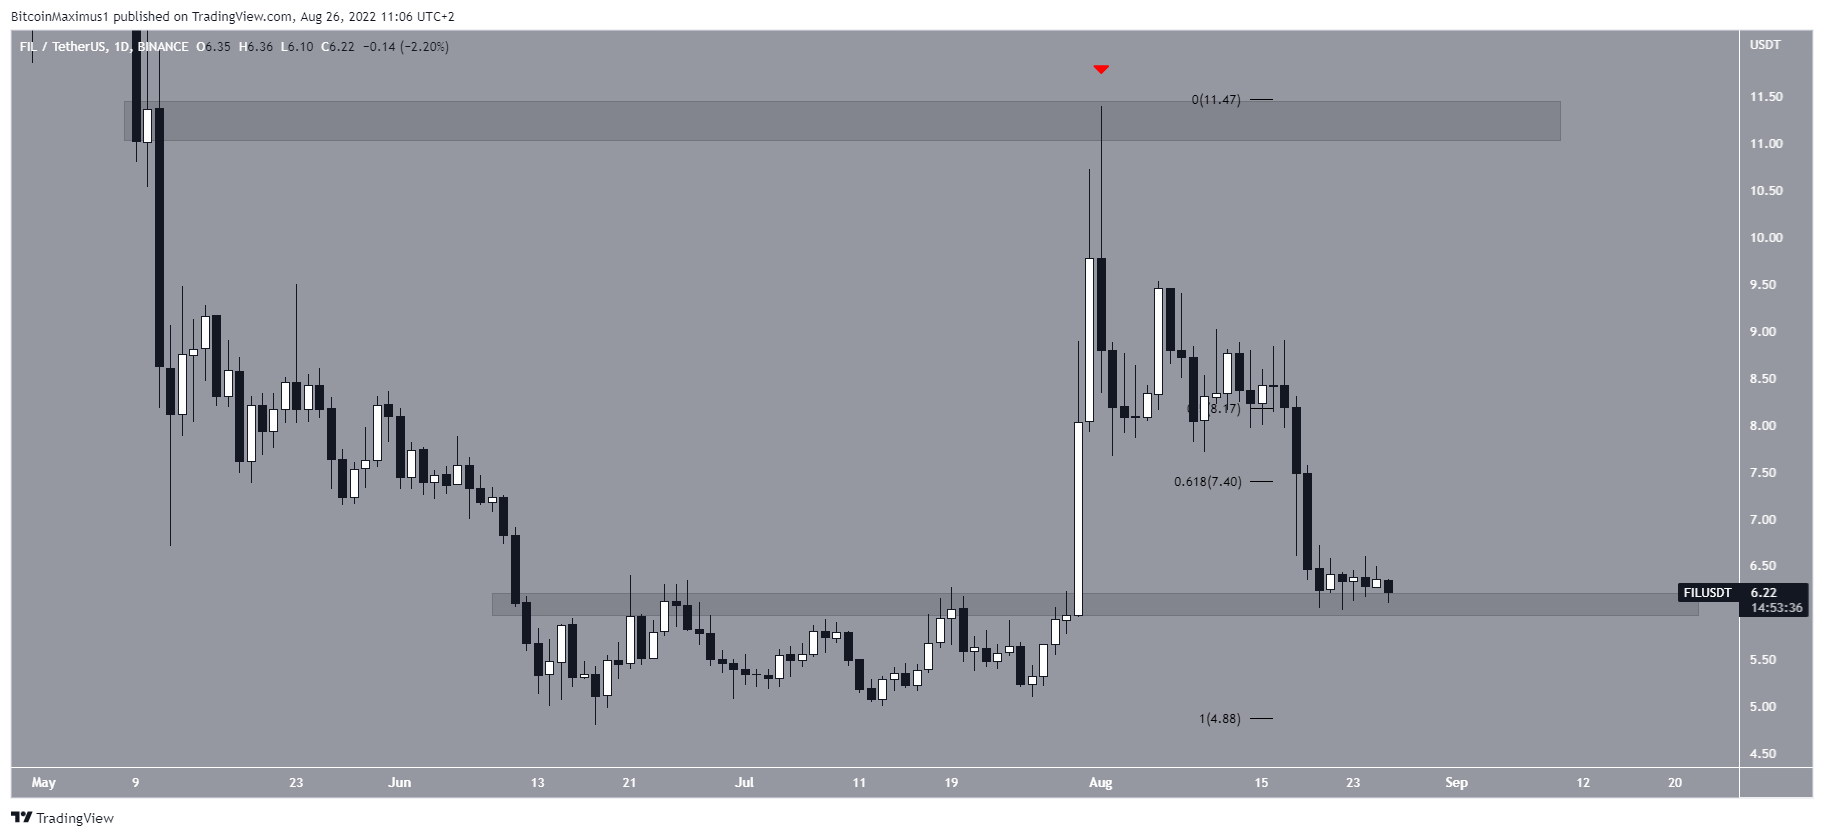
FIL/USDT Chart By TradingView
HNT
HNT has been falling since reaching a high of $12.50 on June 10.
On Aug 22, HNT fell to a new yearly low of $6.30. While it made an attempt at moving upward, it was rejected by the $6.80 resistance area (red icon) and has been falling since.
If the downward movement continues, the two closest support levels would be at $4.92 and $2.88. These levels are created by the 1.27 and 1.61 external Fib retracements of the most recent bounce.
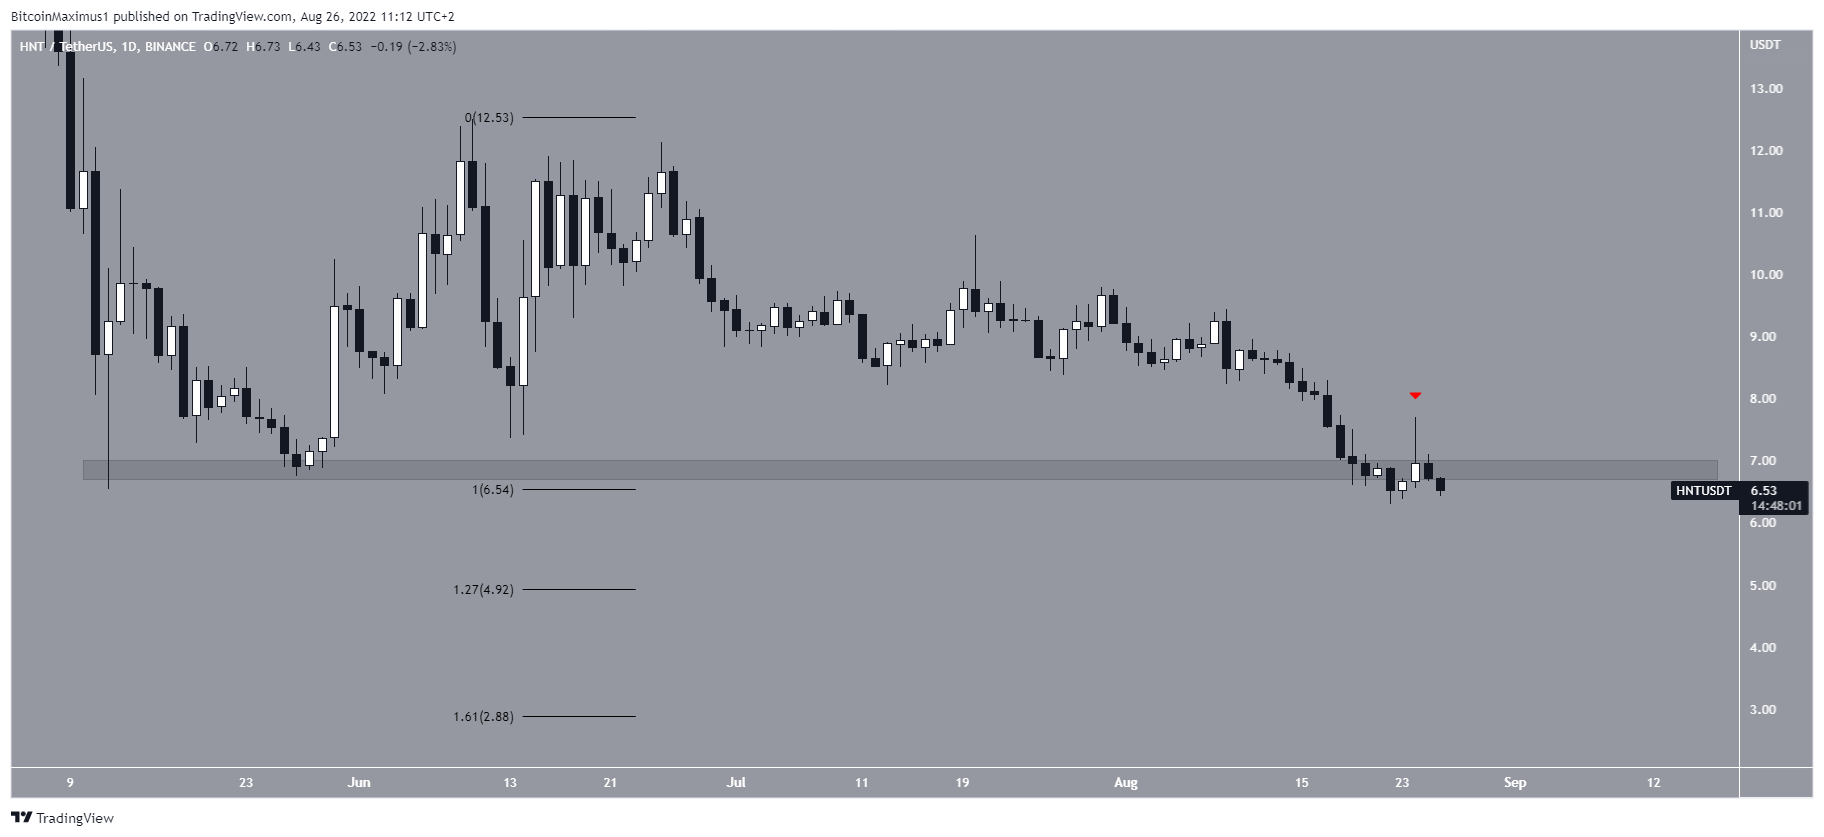
HNT/USDT Chart By TradingView
For Be[in]Crypto’s latest Bitcoin (BTC) analysis, click here


 Bitcoin
  Ethereum
  Tether
  USDC
USDC  Dogecoin
  Cardano
  Bitcoin Cash
  Polygon
  Litecoin
  LEO Token
  Hedera
  Stellar
  Cosmos Hub
  OKB
OKB  Maker
Maker  Algorand
  NEO
NEO  Gate
Gate  KuCoin
  Synthetix Network
  IOTA
IOTA  Tether Gold
  TrueUSD
  Enjin Coin
  Holo
Holo  Ravencoin
  Siacoin
  0x Protocol
  Basic Attention
  Ontology
  Decred
  Zcash
Zcash  Lisk
Lisk  Waves
Waves  DigiByte
  Numeraire
  Status
  Nano
Nano  Pax Dollar
  Steem
Steem  OMG Network
  BUSD
BUSD  Ren
Ren  Bytom
Bytom  Bitcoin Diamond
  HUSD
HUSD  Energi
  Augur
Augur