


Here’s the Next Target for Bitcoin if $24K Falls (BTC Price Analysis)
Bitcoin’s price finally seems to be breaking the $24K resistance level after a period of rejections. The cryptocurrency has rebounded from the $17K-$20K range. It surpassed the 50-day moving average but has so far been unable to breach the $24K level to the upside.
Technical Analysis
By: Edris
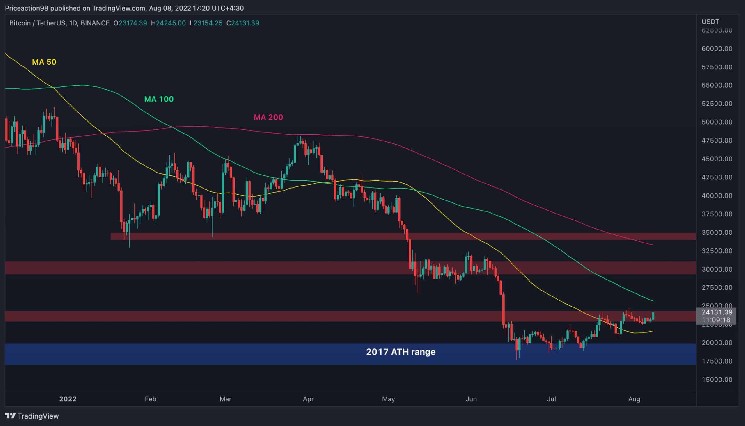
The Daily Chart
It seems like the significant resistance level of $24K may be breached. The 100-day moving average sitting at the $26K mark would then be the next obstacle. If the price can continue above it, the $30K supply zone would be the short-term target.
On the flip side, if the price fails to break the moving average and drops below the $24K mark, another bearish continuation could begin. This could result in a potential crash below the $20K support.

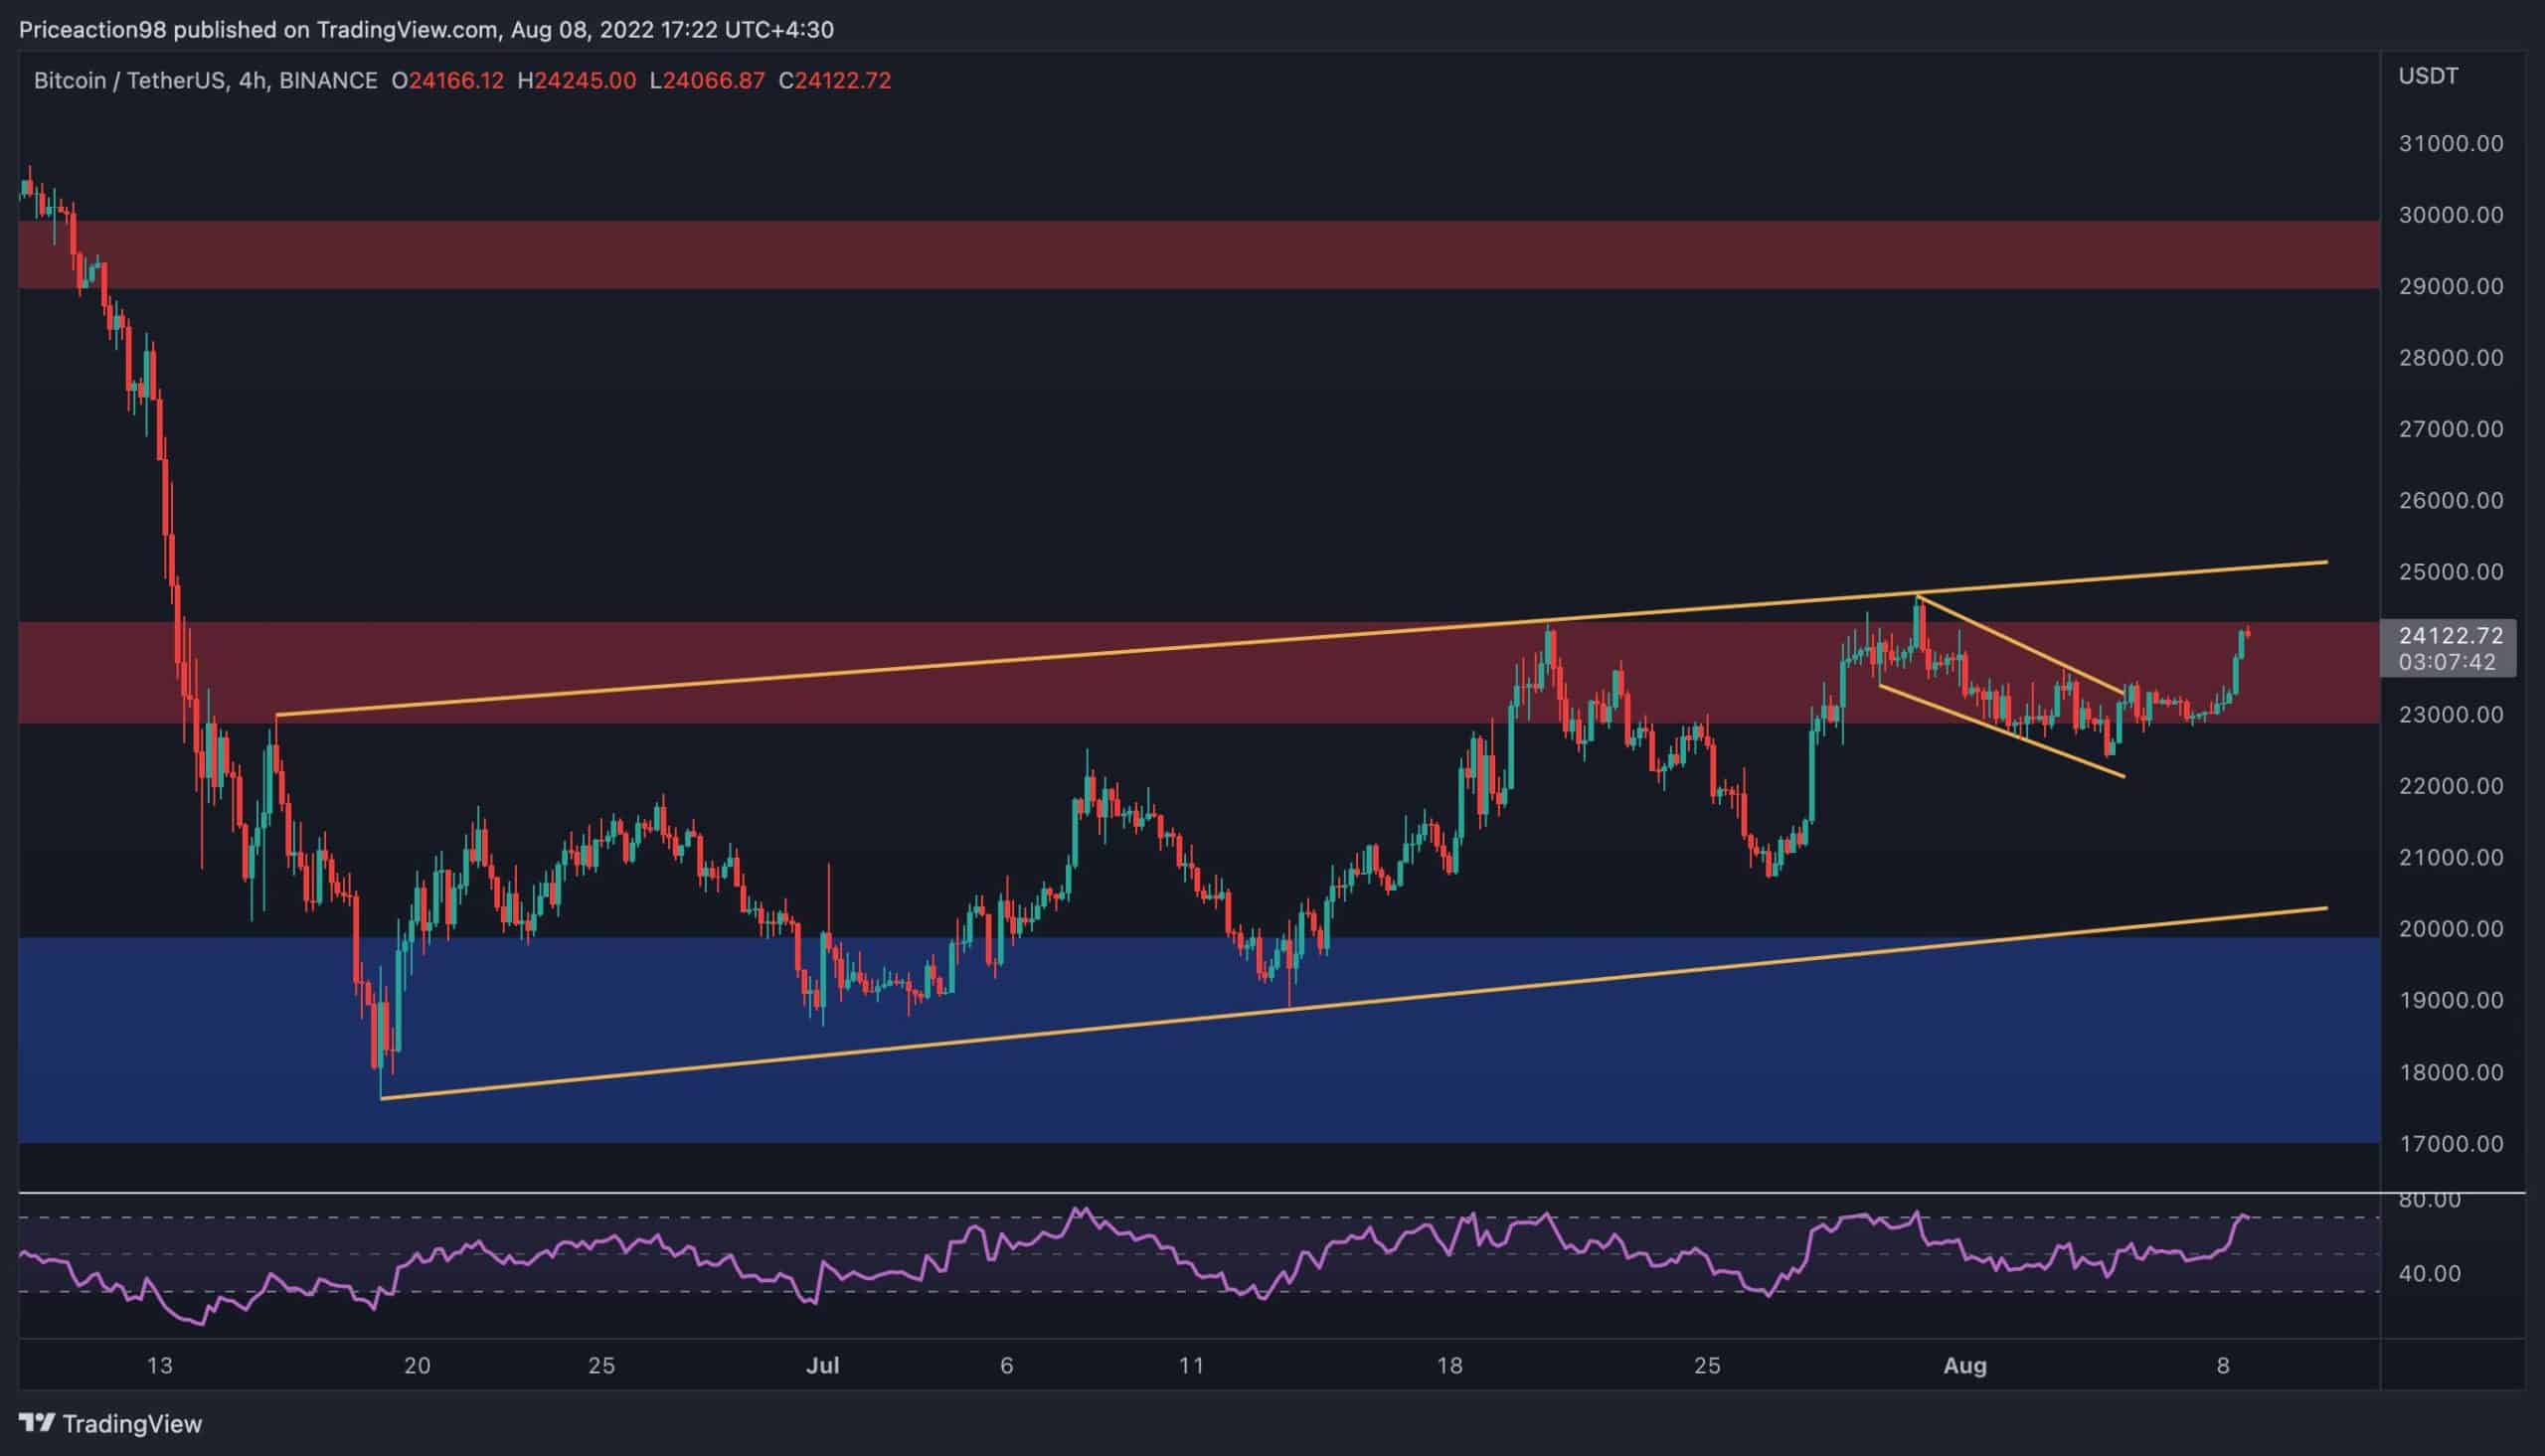
The 4-Hour Chart
On the 4-hour timeframe, the price managed to break the small bullish flag and rallied towards the $24K mark. However, the larger bearish flag is yet to be broken, as the bulls begin their fourth attempt at the higher boundary of the pattern. A valid breakout above the flag would likely lead to a rally towards the $30K supply zone.
At the same time, the RSI indicator is currently signaling an overbought state. This could result in either a short-term pullback or an overall bearish reversal. If the latter is true, a bearish breakout from the flag and continuation below $20K, and even $15K, would be probable. The lower timeframe price action should be monitored carefully this week to determine which scenario is more likely, and act accordingly.
On-chain Analysis
By: Edris
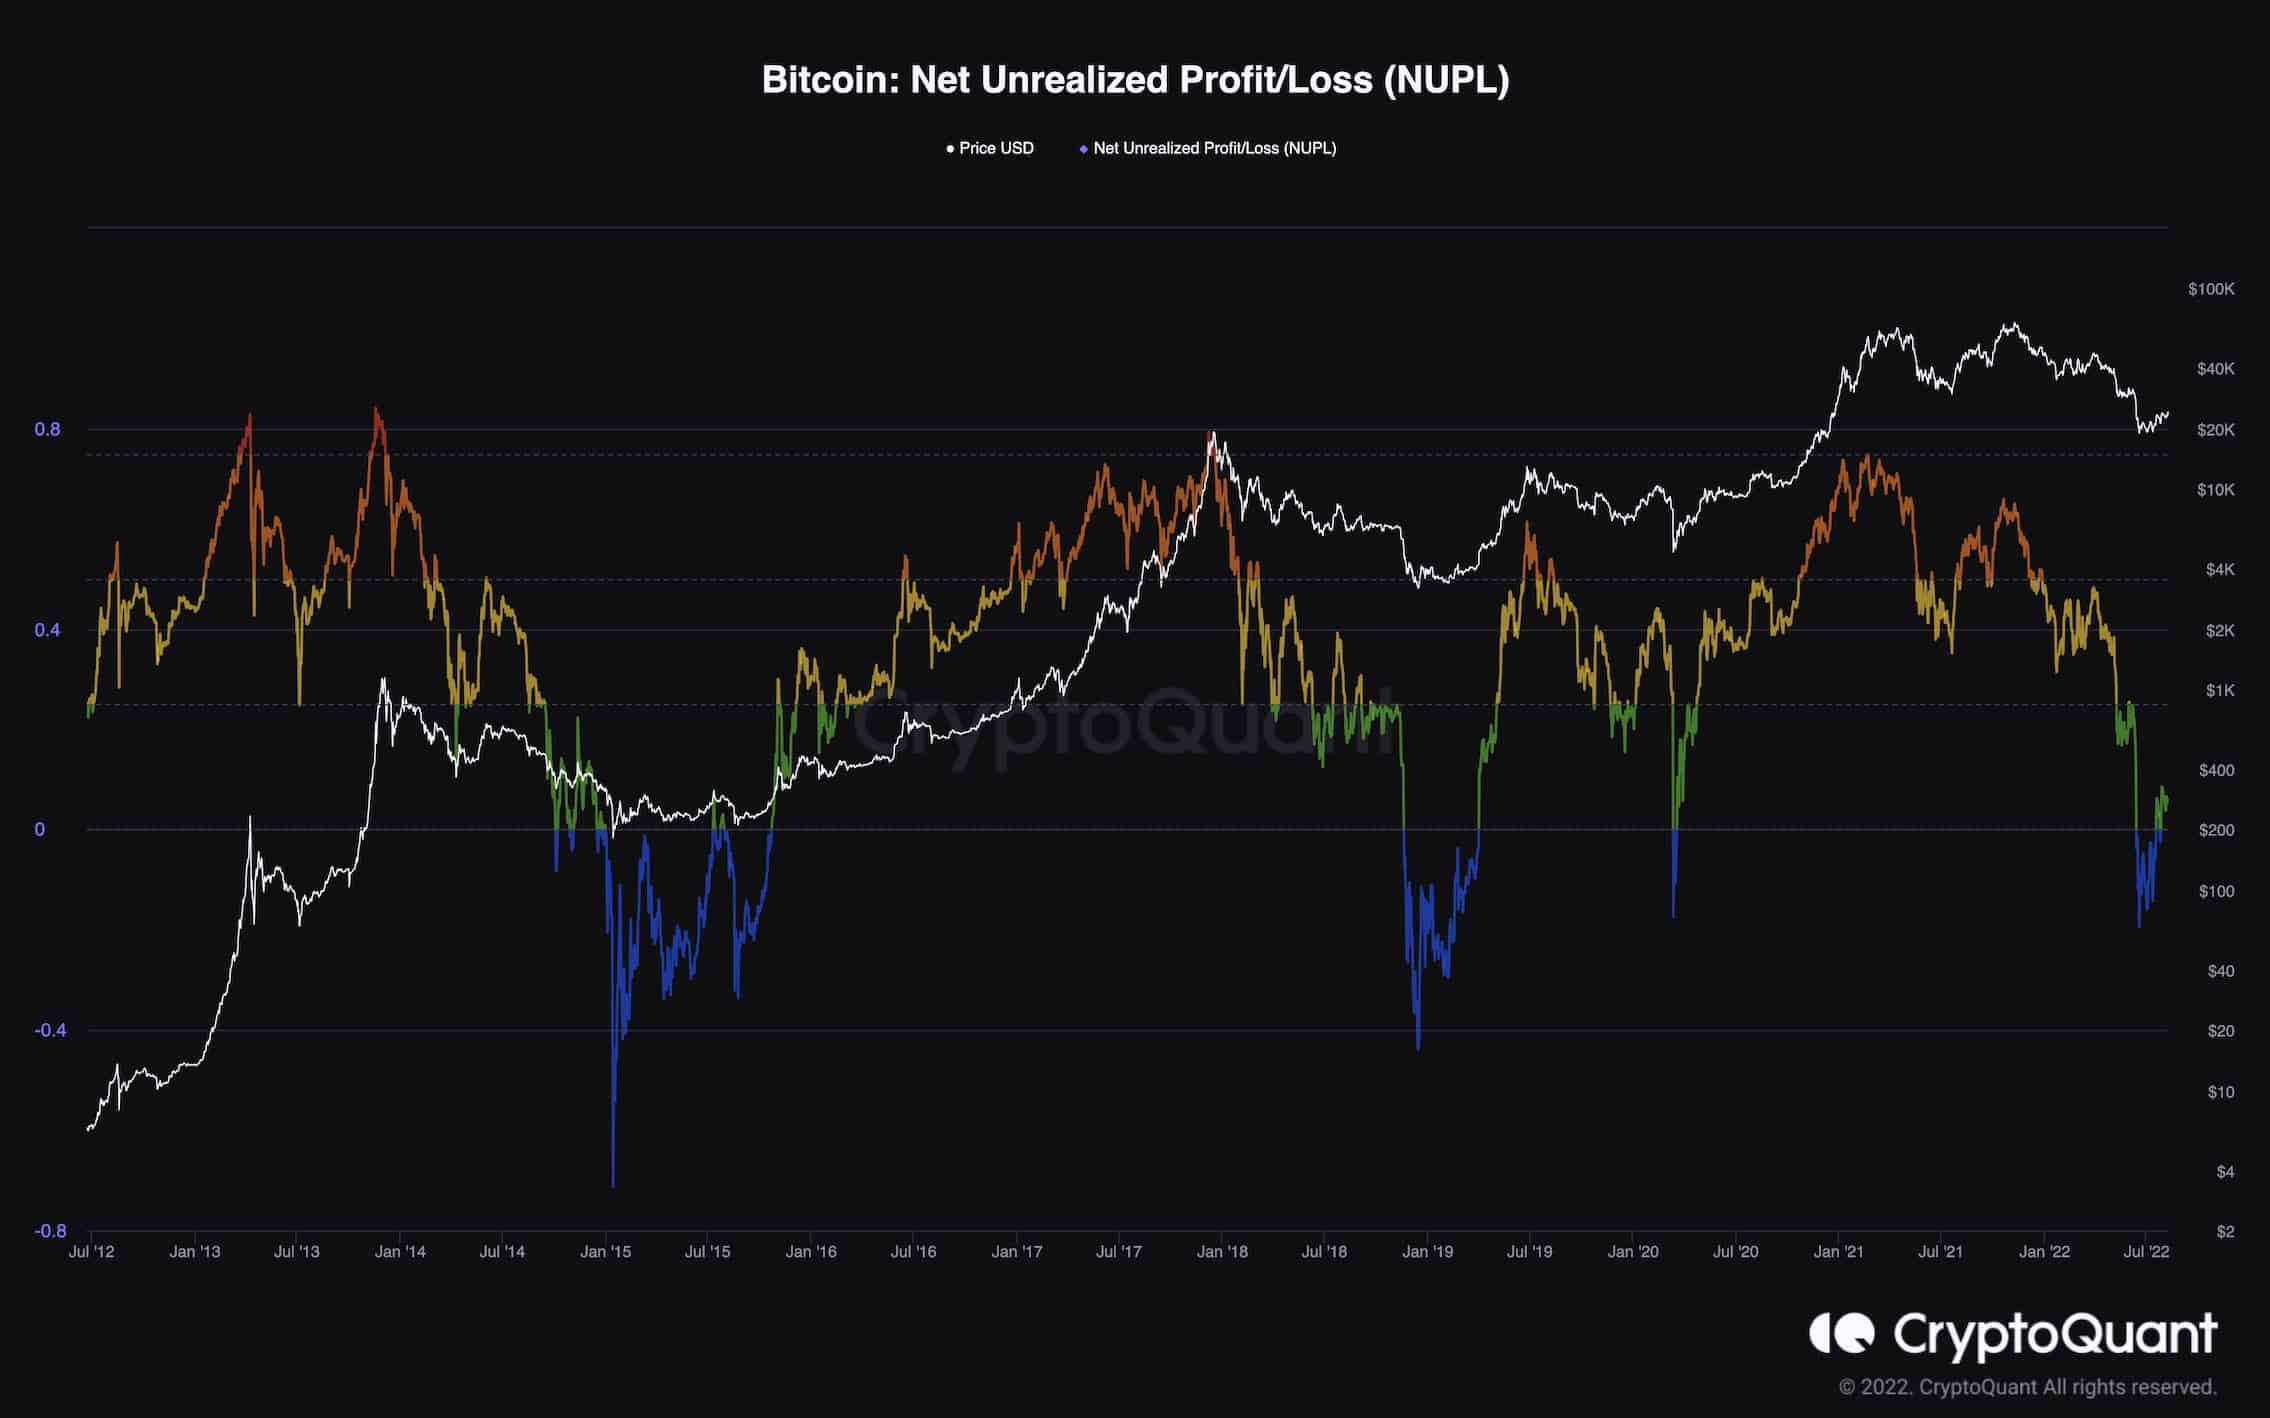
Bitcoin Net Unrealized Profit/Loss
Bitcoin’s strong downtrend over the last few months has put immense pressure on all market participants. Many investors have sold their coins at massive losses and exited the market, fearing more downturn.
And yet, according to Net Unrealized Profit/Losses metric, the market might be nearing the bottom. This metric measures the ratio of unrealized profits/losses. It is a useful indicator to evaluate market sentiment. The market has felt bleak in recent months, as the NUPL metric was demonstrating values below 0 – a region that has identified previous bottoms.
During the recent increase in price, the NUPL has moved back above 0. This has previously signaled the end of bear markets and the beginning of a new uptrend. It’s important to note that other metrics and the overall macroeconomic picture must also be monitored in the short term to determine whether a new bull market or another bull trap is the case.


 Bitcoin
  Ethereum
  Tether
  USDC
USDC  Dogecoin
  Cardano
  Bitcoin Cash
  Polygon
  Litecoin
  LEO Token
  OKB
OKB  Stellar
  Cosmos Hub
  Hedera
  Maker
Maker  Algorand
  NEO
NEO  Synthetix Network
  Gate
Gate  KuCoin
  IOTA
IOTA  Tether Gold
  TrueUSD
  Enjin Coin
  0x Protocol
  Ravencoin
  Holo
Holo  Siacoin
  Basic Attention
  Ontology
  Decred
  Zcash
Zcash  Lisk
Lisk  Waves
Waves  DigiByte
  Numeraire
  Status
  Nano
Nano  Pax Dollar
  Steem
Steem  OMG Network
  BUSD
BUSD  Ren
Ren  Bitcoin Diamond
  Bytom
Bytom  HUSD
HUSD  Energi
  Augur
Augur