


Is Another $19K Retest Inbound for BTC? (Bitcoin Price Analysis)
Market movements are frequently consisting of two phases – an expansion phase where the price changes sharply in either direction, followed by a correction phase in which the price forms continuation patterns. This analysis aims to examine this structure throughout the ongoing bear market.
Technical Analysis
By Shayan
The Weekly Chart
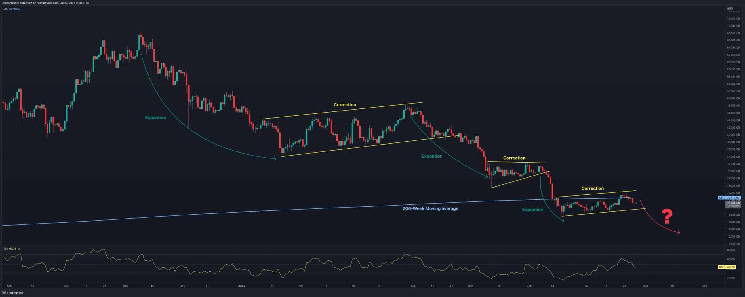
Bitcoin has been descending since the late 2021 ATH and forming expansion moves followed by correction phases. Currently, the price has dropped below its 200-week moving average (~$23K), which is the most critical and decisive level for Bitcoin, followed by a pullback. Meanwhile, the cryptocurrency has formed a continuation correction pattern and was rejected from the upper boundary.
Considering the mentioned price action patterns, there is a good chance that Bitcoin will plunge from this price level and reach lower demand regions. However, the probable bearish leg might be the last move down to complete the capitulation event between the market participants.

The 4-Hour Chart
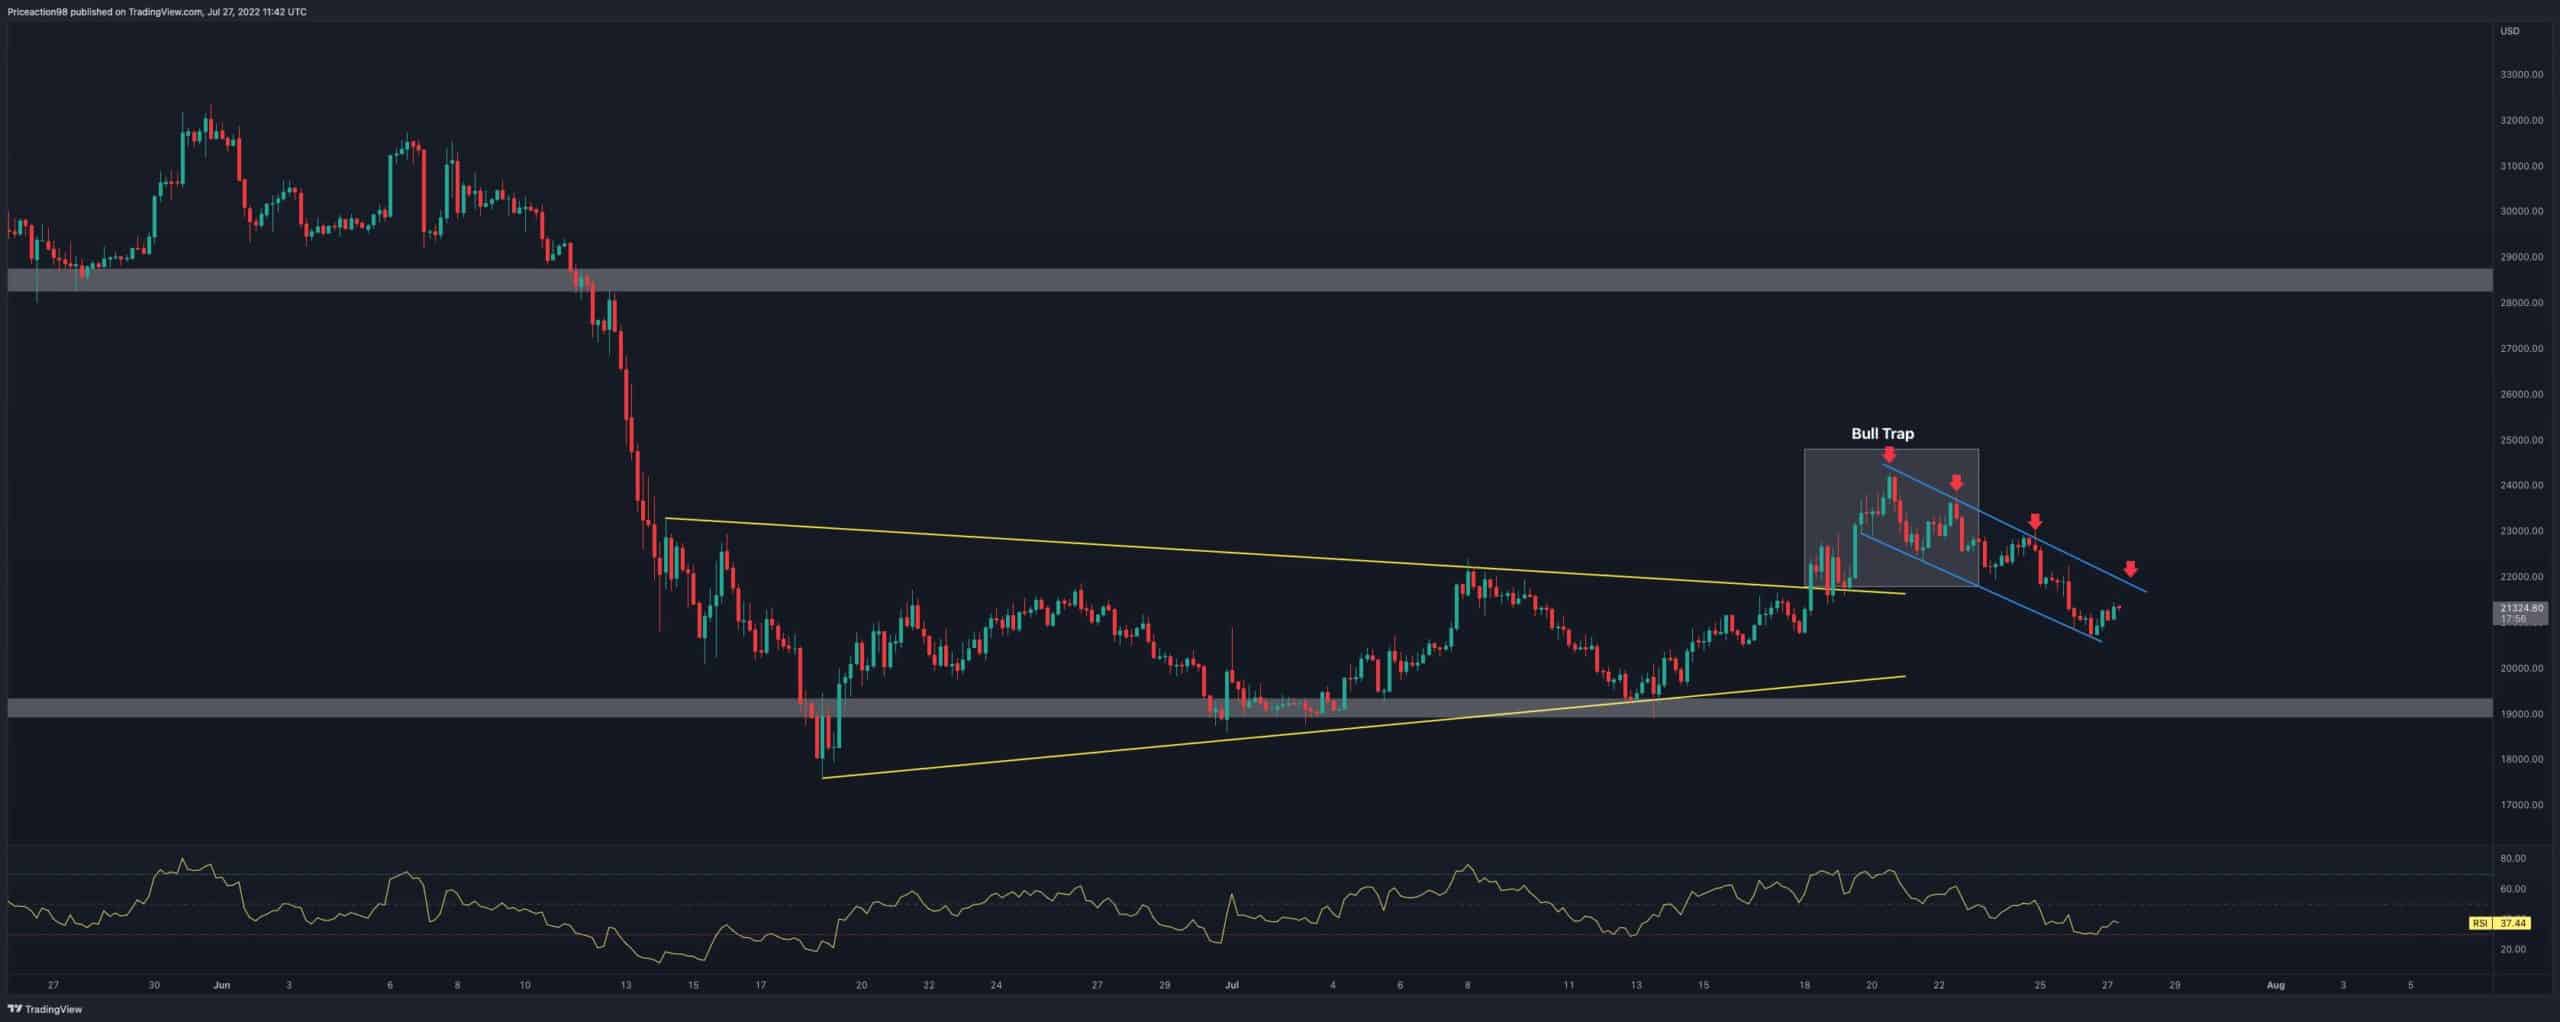
After experiencing a bearish expansion move a few weeks ago, Bitcoin had formed a well-known wedge price action pattern. On the other hand, the $19K level has served as excellent support and initiated a new bullish rally. However, after breaking the wedge’s upper trendline and forming a pullback, the bulls overcame the bears, and BTC experienced another rally.
The rally turns out to be an effective bull trap, the price has plummeted since then. Considering this bull trap and the price action, Bitcoin seems likely to experience another leg down to retest the $19K. If the $19K significant support level fails to hold the price, Bitcoin’s next destination will be the $16K mark.
Onchain Analysis
Miners Fee to Reward Ratio calculates the percentage of the fee in the total block reward. Typically, during a bull run, this indicator spikes and indicates higher values, which demonstrate greater miner incentive to mine Bitcoin and more network activity, a sign of a healthy bull market.
In contrast, the indicator drops significantly during bear markets, almost close to zero, which shows capitulation. However, the metric experienced a steady rise at the end of the bearish cycles, a sign of accumulation among market participants.
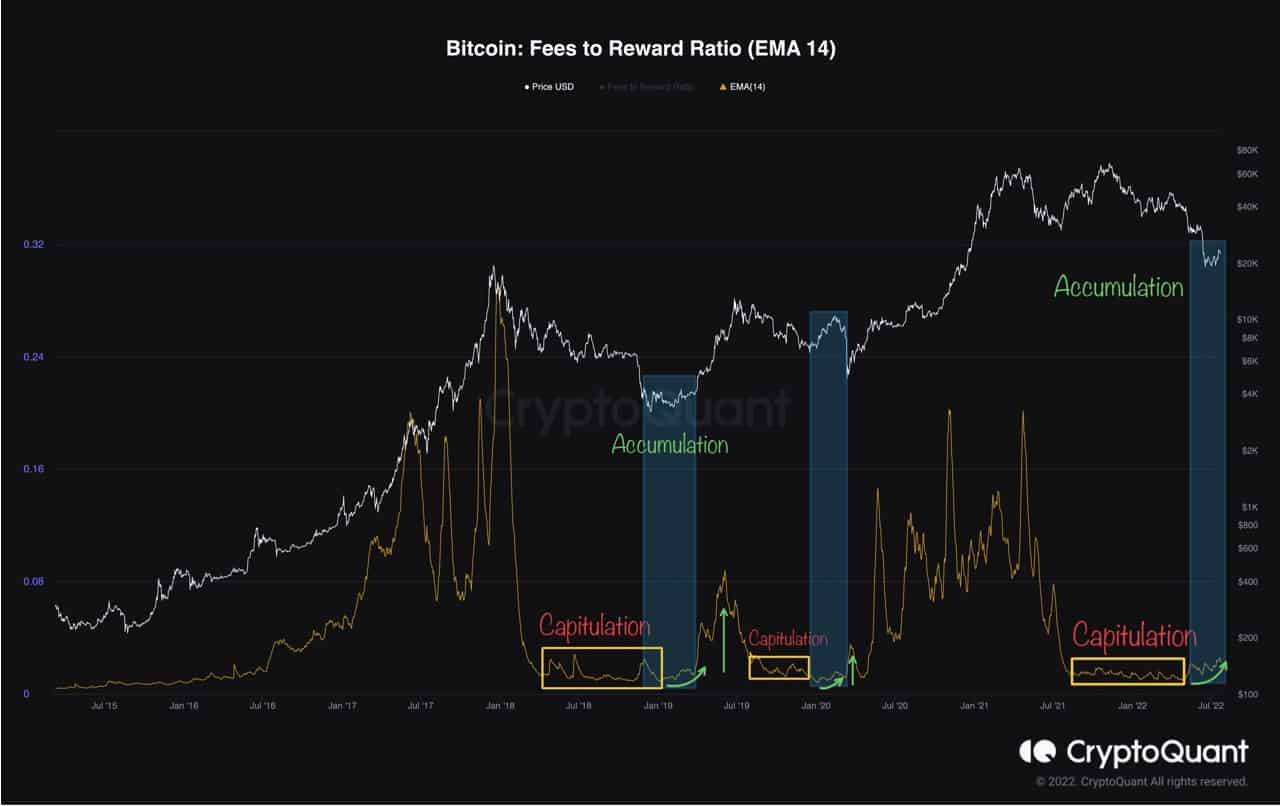
As a result, Bitcoin has always experienced a surge and initiated the next bullish cycle after the accumulation. Currently, the metric has dropped to zero after BTC experienced a 75% decline in its price and is rising slowly.


 Bitcoin
  Ethereum
  Tether
  USDC
USDC  Dogecoin
  Cardano
  Bitcoin Cash
  Polygon
  Litecoin
  LEO Token
  OKB
OKB  Stellar
  Cosmos Hub
  Hedera
  Maker
Maker  Algorand
  NEO
NEO  Synthetix Network
  Gate
Gate  KuCoin
  IOTA
IOTA  Tether Gold
  TrueUSD
  Enjin Coin
  0x Protocol
  Ravencoin
  Holo
Holo  Siacoin
  Basic Attention
  Ontology
  Decred
  Zcash
Zcash  Lisk
Lisk  Waves
Waves  DigiByte
  Numeraire
  Status
  Nano
Nano  Pax Dollar
  Steem
Steem  OMG Network
  BUSD
BUSD  Ren
Ren  Bitcoin Diamond
  Bytom
Bytom  HUSD
HUSD  Energi
  Augur
Augur