


Litecoin price analysis: LTC prices suffer a further downtrend to lows of $60.69

Recent Litecoin price analysis shows that the coin has been on a downtrend, losing over 4 percent in value in the last 24 hours. The LTC/USD pair is currently trading at $60.69 after touching lows of $60.03 earlier today. The coin has been on a downtrend since the beginning of the month when it was trading at highs of $70.50. However, the bears have been in control and have pushed prices lower.
The 24-hour trading volume for the coin is $437 million, and the total market capitalization is $4.32 billion The LTC/USD pair is currently down 27% from its monthly highs. On the daily chart, Litecoin price analysis shows that the coin has lost over 8% in value in the last 7 days.
LTC/USD 1-day price analysis: Bears take control
The 24-hour chart for the Litecoin price analysis shows that the LTC/USD pair has been on a downtrend for the last 24 hours. The LTC token was on a positive trend as it rose from $59.73 to highs of $64.04. However, the bulls failed to sustain the momentum and prices started falling. The MACD is currently bearish, as expressed in the red color of the histogram. However, the indicator shows low bearish momentum as it has just exhibited a crossover due to the strong bearish activity taking place in recent hours.
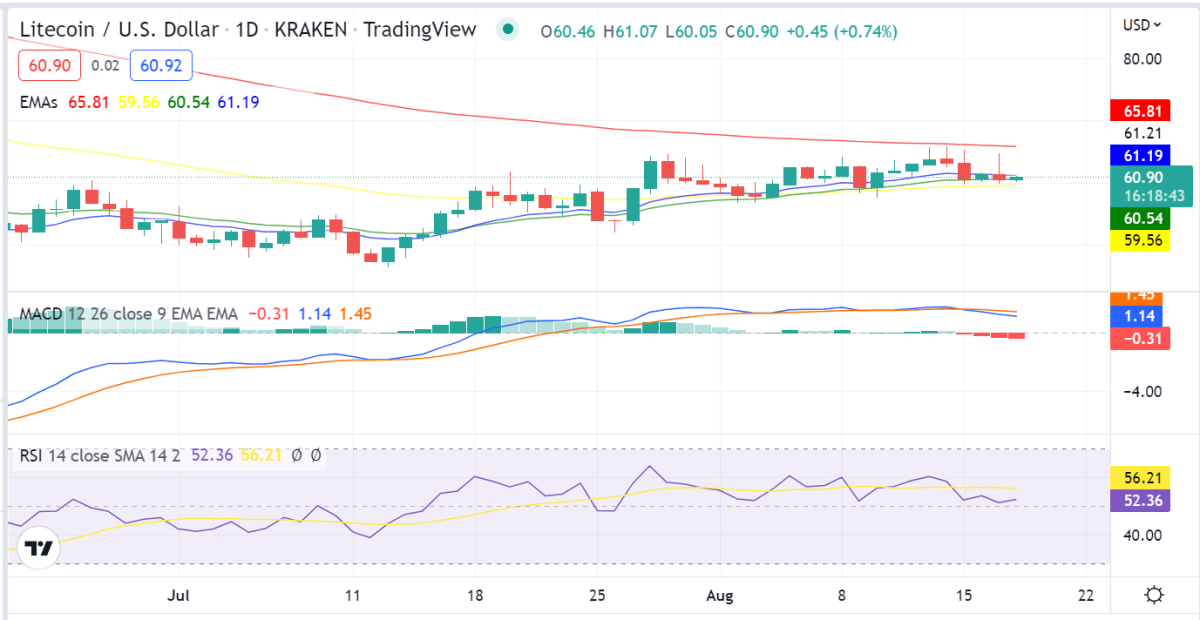
LTC/USD 1-day price chart. Source: TradingView
The 50 EMA is trading below the 200 EMA, which is a strong bearish sign. The EMA’s are currently bearish as the price is trading below both of them. The RSI indicator for the LTC/USD pair is currently at 43.03, which shows that the market is currently in the oversold region. The Stochastic indicator is also in the oversold region but is starting to head towards the center.
LTC/USD 4-hour price chart: LTC finds support at $60.03
The hourly chart for the LTC/USD pair shows that the bulls have been attempting to push prices higher in recent hours. The LTC token was trading at lows of $60.03 but has found some support at this level and is currently trading at $60.69.
The 4-hour Moving Average Convergence Divergence indicator shows that the market is currently in a bearish trend as the MACD line is trading below the signal line. The Relative Strength Index indicator for the LTC/USD pair is currently below the 50 level, which is a bearish sign.
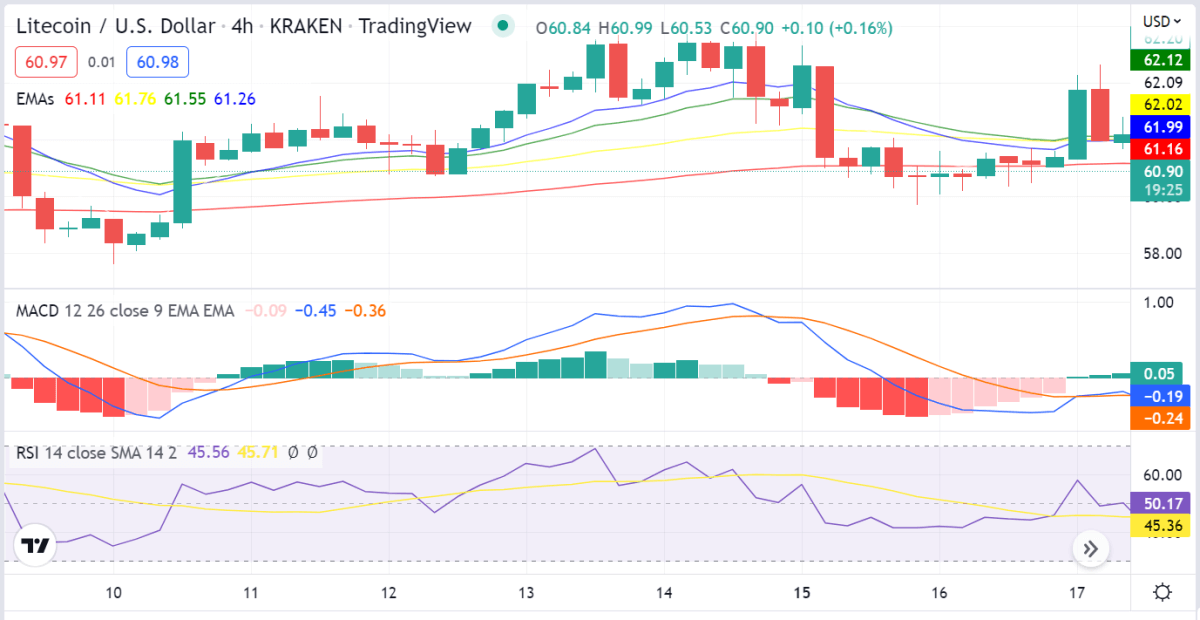
LTC/USD 4-hour price chart, Source: TradingView
The EMAs are currently trading around the mean position as net price movement over the last seven days remains low. However, as the markets observe selling activity, the EMAs show signs of a bearish divergence, with the 50-EMA taking the lead in moving downwards to reflect the recent price movements.
Litecoin price analysis conclusion
Overall, Litecoin price analysis shows that the coin is trading in a bearish trend as the bulls have failed to break above the $64.04 resistance level, however, if the bulls can take control and push prices above the $64.04 resistance level, we could see prices target the $66 resistance level. However, if the bears continue to exert their pressure, we could see prices target the $60 support level. The market is currently in a bearish trend as reflected by the indicators.
Disclaimer. The information provided is not trading advice. Cryptopolitan.com holds no liability for any investments made based on the information provided on this page. We strongly recommend independent research and/or consultation with a qualified professional before making any investment decisions.


 Bitcoin
  Ethereum
  Tether
  USDC
USDC  Dogecoin
  Cardano
  Bitcoin Cash
  Polygon
  Litecoin
  LEO Token
  OKB
OKB  Cosmos Hub
  Stellar
  Hedera
  Maker
Maker  Algorand
  NEO
NEO  Synthetix Network
  Gate
Gate  KuCoin
  IOTA
IOTA  Tether Gold
  TrueUSD
  Enjin Coin
  0x Protocol
  Ravencoin
  Holo
Holo  Siacoin
  Basic Attention
  Decred
  Zcash
Zcash  Ontology
  Waves
Waves  Lisk
Lisk  DigiByte
  Numeraire
  Status
  Nano
Nano  Pax Dollar
  Steem
Steem  OMG Network
  BUSD
BUSD  Ren
Ren  Bitcoin Diamond
  Bytom
Bytom  HUSD
HUSD  Energi
  Augur
Augur