


Litecoin price analysis: LTC recovers to $62.23 as bullish impulse returns

Litecoin price analysis indicates that the cryptocurrency has found support at $60.50 and currently trading at the $62.23 mark. The market is expecting a breakout from the ascending triangle pattern formation. Litecoin has been on an uptrend over the past few days as it surged from $55 to $60 levels. The market is currently facing resistance at the $64.56 mark, and a breakout above this level could see Litecoin’s price target at the $65.50 mark.
Litecoin price analysis shows that the digital asset has started gaining some momentum as the trading volume is increasing lately, which is currently at $522,188,778. LTC is ranked at position 6 in the market with a total market capitalization of $4,416,063,225. Litecoin price analysis suggests that the digital asset is likely to continue its upward trend in the near term as long as it sustains above the $62.23 mark.
LTC/USD price analysis on a daily timeframe: Bulls push for higher prices
On the 24-hour candlestick chart for Litecoin price analysis, the price can be seen forming an extended ascending triangle pattern which has been in place for quite some time now. The LTC/USD bulls have pushed for higher prices after the market found support at $60 levels. The Litecoin price is currently trading above the $62.23 level, and a breakout from the ascending triangle pattern could see Litecoin targetting the $65.50 resistance level.
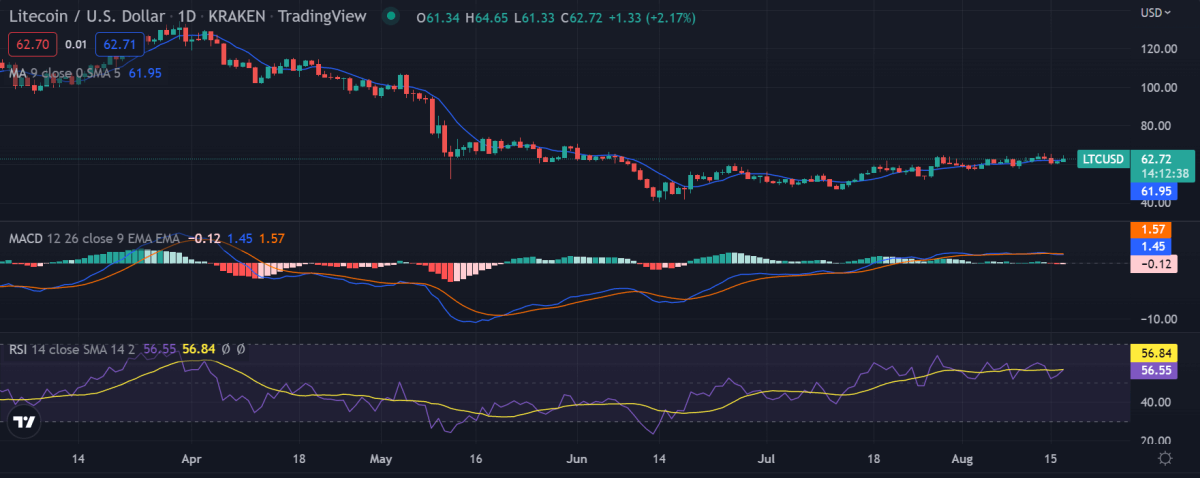
LTC/USD 1-day price chart, Source: TradingView
The Relative Strength Index(RSI) for LTC is currently at the 60.00 mark, and it looks like the digital asset has some more room to go before it becomes overbought. The Moving Average Convergence Divergence(MACD) indicator on the daily timeframe shows that the MACD line is currently trading above the signal line, indicating a bullish trend in the market. The LTC/USD pair is trading well above the moving averages which indicates that the bulls have the upper hand in the market.
LTC/USD 4-hour price chart: LTC is bullish
Litecoin price analysis shows that the market is currently trading at the $62.23 level on the 4-hour timeframe and is looking poised for a breakout from the ascending triangle pattern that has been in place for quite some time now. The LTC/USD bulls have pushed for higher prices after the market increased by over 3% in the past few hours.
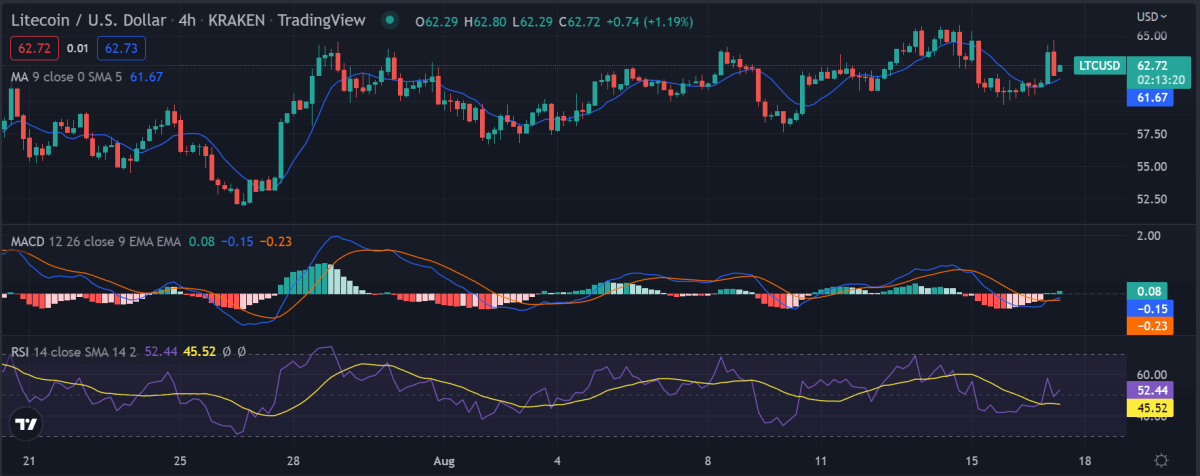
LTC/USD 4-day price chart, Source: TradingView
The 50 MA(yellow line) is currently trading above the 200 MA(red line), indicating a bullish trend in the market. The MACD indicator on the 4-hour timeframe is currently in bullish territory as the MACD line is trading above the signal line. The Relative Strength Index(RSI) for LTC is currently at the 60.23 level, and it looks like Litecoin has some more room to go before it becomes overbought.
Litecoin price analysis conclusion
Litecoin price analysis on both the daily and 4-hour timeframe shows that the digital asset has found support at $60.50 and currently trading at $62.23. The investors are now waiting for a breakout from the ascending triangle pattern to initiate a firm bullish momentum. Bulls are still in control as they target the $65 price level. The technical indicators on both timeframes are currently in bullish territory but are losing their momentum.
Disclaimer. The information provided is not trading advice. Cryptopolitan.com holds no liability for any investments made based on the information provided on this page. We strongly recommend independent research and/or consultation with a qualified professional before making any investment decisions.


 Bitcoin
  Ethereum
  Tether
  USDC
USDC  Dogecoin
  Cardano
  Bitcoin Cash
  Polygon
  Litecoin
  LEO Token
  Hedera
  Stellar
  Cosmos Hub
  OKB
OKB  Maker
Maker  Algorand
  NEO
NEO  Gate
Gate  KuCoin
  Synthetix Network
  IOTA
IOTA  Tether Gold
  TrueUSD
  Enjin Coin
  Holo
Holo  Ravencoin
  0x Protocol
  Siacoin
  Basic Attention
  Decred
  Ontology
  Zcash
Zcash  Lisk
Lisk  Waves
Waves  DigiByte
  Numeraire
  Status
  Nano
Nano  Pax Dollar
  Steem
Steem  OMG Network
  BUSD
BUSD  Ren
Ren  Bytom
Bytom  Bitcoin Diamond
  HUSD
HUSD  Energi
  Augur
Augur