


Litecoin price analysis: LTC/USD bearish as price slips to $55.92

Litecoin price analysis shows that the LTC/USD pair is currently in a bearish trend. The price has slipped below the $55.92 level. The LTC/USD pair will likely find support at the $55.46 level and may rebound from this level. However, if the price falls below the $55.46 level, it could retest the $54.00 support level. On the other hand, if the price rises above the $55.92 level, it could face resistance at the $61.46 level. Above this level, Litecoin’s price could test the $64.00 resistance level.
Litecoin’s price currently trades at $55.92 and is down by 4.09 percent on the day. The LTC/USD pair has a bearish short-term bias while trading below the $61.46 level. The 24-hour trading volume is $3.38 billion and the LTC/USD pair has a market capitalization of $612 million.
Litecoin price analysis on a 1-day price chart: LTC/USD continues downside after facing rejection of $61.46
The 1-day Litecoin price analysis shows that the LTC/USD pair has been on a bearish trend for the last 24 as the price has slipped below the $55.92 level. The LTC/USD pair is following a descending channel pattern after it found resistance at the $61.46 level. The Bulls were not able to push the price above this level.
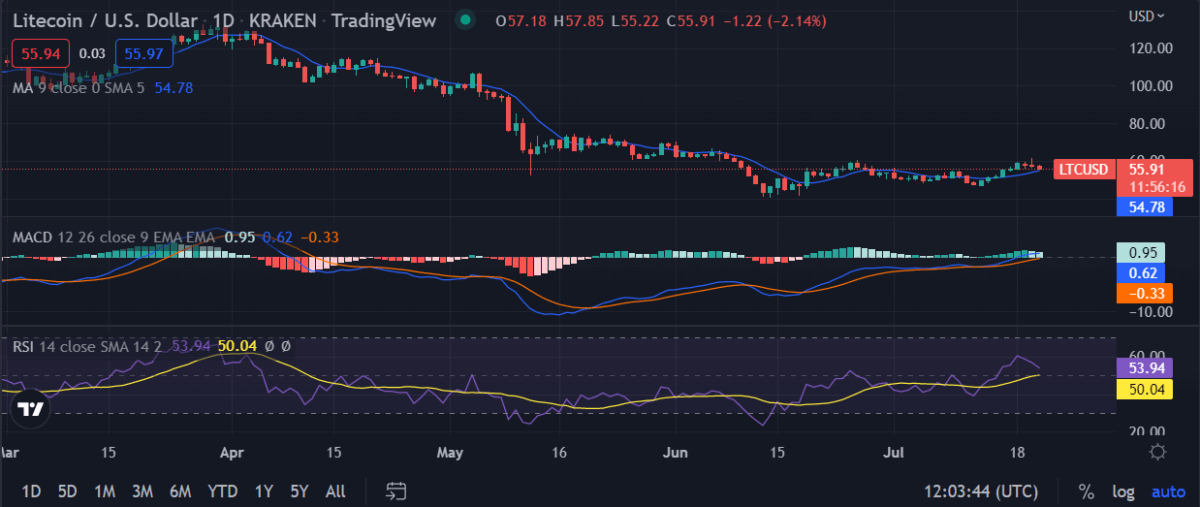
LTC/USD 1-day price chart, source: TradingView
The technical indications show the prices are trading along with the descending channel support and a bearish reversal pattern is taking shape. The moving averages are currently in a bearish crossover. The MACD is trading in the bearish territory below the signal line. The RSI is currently near the oversold levels and shows no signs of a bullish reversal.
Litecoin price analysis: Recent developments and further technical indications
The 4-hour time frame for Litecoin price analysis is showing that a bearish head and shoulders pattern has formed. A breakdown below the $55.46 level would confirm the formation of this bearish pattern. If this pattern is confirmed, the LTC/USD pair is likely to decline towards the $50.00 level. The overall market sentiment is bearish as most of the major cryptocurrencies are currently trading in the red.
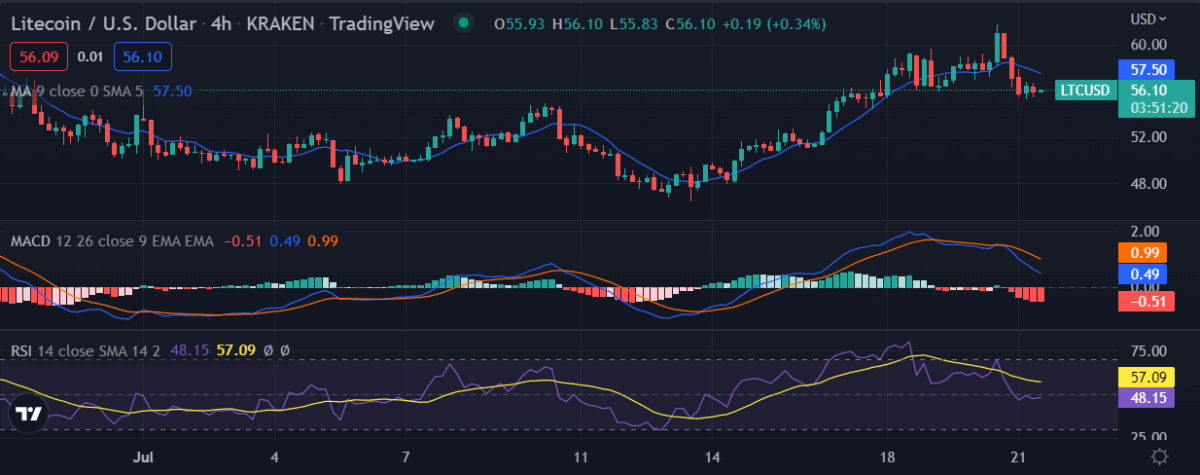
LTC/USD 4-hour price chart, source: TradingView
The 4-hour timeframe shows that the LTC/USD pair is trading below the moving averages indicator. This means that the current trend is bearish. The MACD line is currently in bearish territory, which is a sign that the downside momentum is likely to continue in the near term. The RSI indicator is currently at 46.50 and is showing no signs of a bullish reversal at this stage.
Litecoin price analysis conclusion
Litecoin price analysis in conclusion indicates a market that is currently in a correction phase after the recent bullish move. The market is facing some selling pressure as it is trading below the $55.92 level. The technical indicators are also showing some bearish signs in the near term. If the price falls below the $54.60 level, it could decline towards the $50.00 level.


 Bitcoin
  Ethereum
  Tether
  USDC
USDC  Dogecoin
  Cardano
  Bitcoin Cash
  Polygon
  Litecoin
  Hedera
  LEO Token
  Stellar
  Cosmos Hub
  OKB
OKB  Maker
Maker  Algorand
  NEO
NEO  Gate
Gate  Synthetix Network
  KuCoin
  IOTA
IOTA  Tether Gold
  TrueUSD
  Enjin Coin
  Holo
Holo  0x Protocol
  Ravencoin
  Siacoin
  Basic Attention
  Ontology
  Decred
  Zcash
Zcash  Waves
Waves  Lisk
Lisk  DigiByte
  Status
  Numeraire
  Nano
Nano  Steem
Steem  Pax Dollar
  OMG Network
  BUSD
BUSD  Ren
Ren  Bytom
Bytom  Bitcoin Diamond
  HUSD
HUSD  Energi
  Augur
Augur