


NEAR Technical Analysis: Bad News For Near Protocol With This Fallout

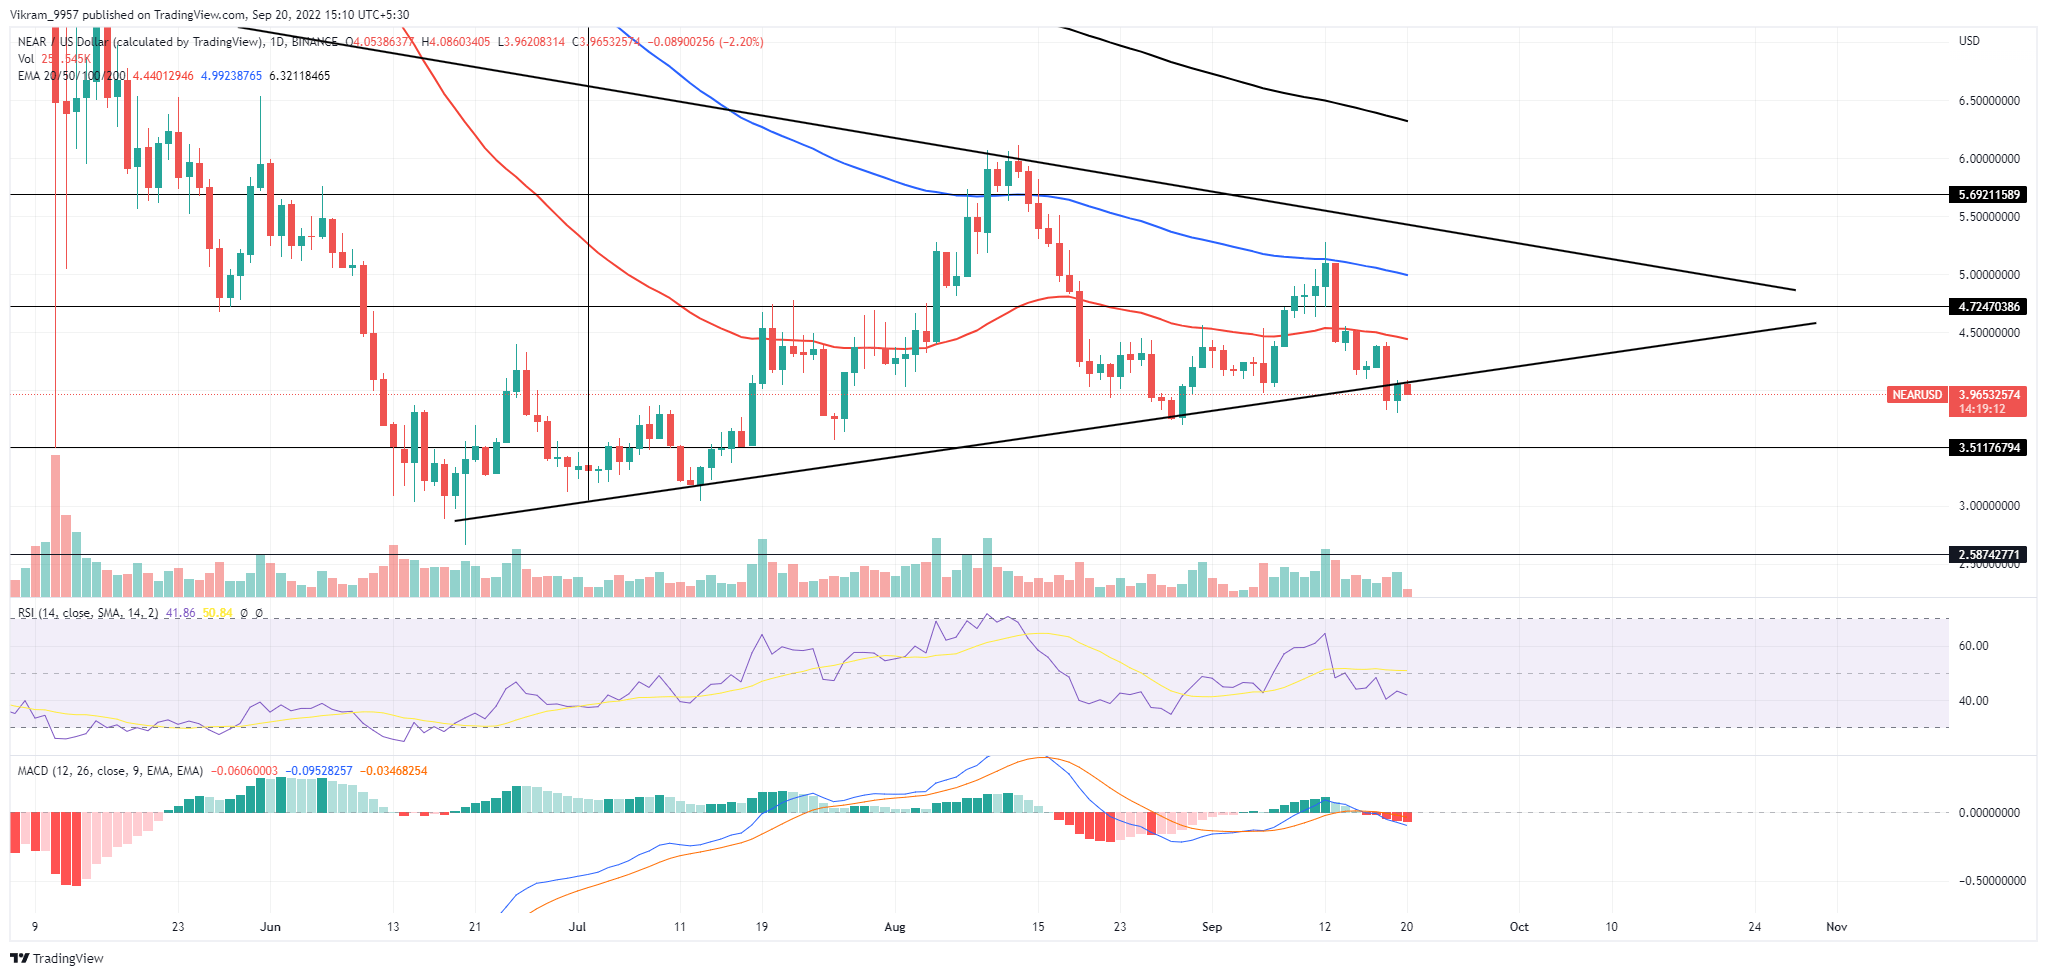
The NEAR technical analysis displays a triangle fallout in the daily chart, providing a selling opportunity at the current prices with the ongoing retest. The NEAR price action displays a bearish breakout rally of a symmetrical triangle pattern after an early reversal from the 100-day EMA. However, the lack of a surge in intraday trading volume lights a fakeout possibility, as buyers might push the prices back above the trendline. So should you sell or wait for the post-retest reversal?
Key Points:
- The Near Protocol prices show a retest phase of the broken trendline.
- The post-retest reversal shows potential to reach the $3.5 mark.
- The intraday trading volume in Near Protocol is $272 Million.
Source-Tradingview
NEAR Technical Analysis
The NEAR price displays an early bearish reversal within the triangle pattern, resulting in a symmetrical triangle breakout. The breakdown of the support trendline fails to unleash the trapped momentum as the prices reverse from $3.85 to retest the broken trendline. However, a bearish turnaround from the 100-day EMA also breaks the 50-day EMA and restarts the falling trend in the EMAs. Nonetheless, the growing bearish influence over the daily candle reflects a possible downtrend to the $3.5 mark. The post-retest downfall will depreciate the coin price by 26.5% and plunge it back to the June-July bottom support of $3. First, however, the sellers must break the $3.85 and $3.5 support levels, which remain potential bullish launchpads. On a country note, if sellers cannot sustain prices below the breached trendline, the uptrend will re-enter the triangle and potentially reach the resistance at $4.72.
Technical Indicator
The RSI slope dives deeper into the bearish territory, indicating growth in selling momentum. Moreover, the MACD and signal lines plunged below the midline signals, aggressively selling in the market. Therefore, the momentum indicators take a bearish side by reflecting an increase in selling pressure. As a result, the NEAR technical analysis offers a selling opportunity upon the $3.85 breakout. Resistance levels- $4 and $4.72 Support levels- $3.85 and $3.5


 Bitcoin
  Ethereum
  Tether
  USDC
USDC  Dogecoin
  Cardano
  Bitcoin Cash
  Polygon
  Litecoin
  LEO Token
  OKB
OKB  Stellar
  Cosmos Hub
  Hedera
  Maker
Maker  Algorand
  NEO
NEO  Synthetix Network
  Gate
Gate  KuCoin
  IOTA
IOTA  Tether Gold
  TrueUSD
  Enjin Coin
  0x Protocol
  Ravencoin
  Holo
Holo  Siacoin
  Basic Attention
  Decred
  Zcash
Zcash  Ontology
  Lisk
Lisk  Waves
Waves  DigiByte
  Numeraire
  Status
  Nano
Nano  Pax Dollar
  Steem
Steem  OMG Network
  BUSD
BUSD  Ren
Ren  Bitcoin Diamond
  Bytom
Bytom  HUSD
HUSD  Energi
  Augur
Augur