


NEAR Technical Analysis: Within Wedge, Buyers Prepare Escape Plan

According to the technical analysis, NEAR prices show a bullish reversal within the bearish wedge pattern teasing an uptrend continuation and leading to a breakout rally. The bearish retracement in the NEAR prices forms a bearish wedge pattern accounting for a drop of 25% over the last two weeks. However, the recent bullish reversal within the bearish pattern projects the possibility of a bullish breakout. So, should you consider buying NEAR tokens before the bullish breakout?
Key Points:
- The NEAR price action forms a bearish wedge pattern in the daily chart.
- The RSI slope shows a remarkable reversal in the nearly oversold boundary.
- With a market cap of $3.17 billion, the intraday trading volume of Near Protocol has increased by 8% to reach $227 million.
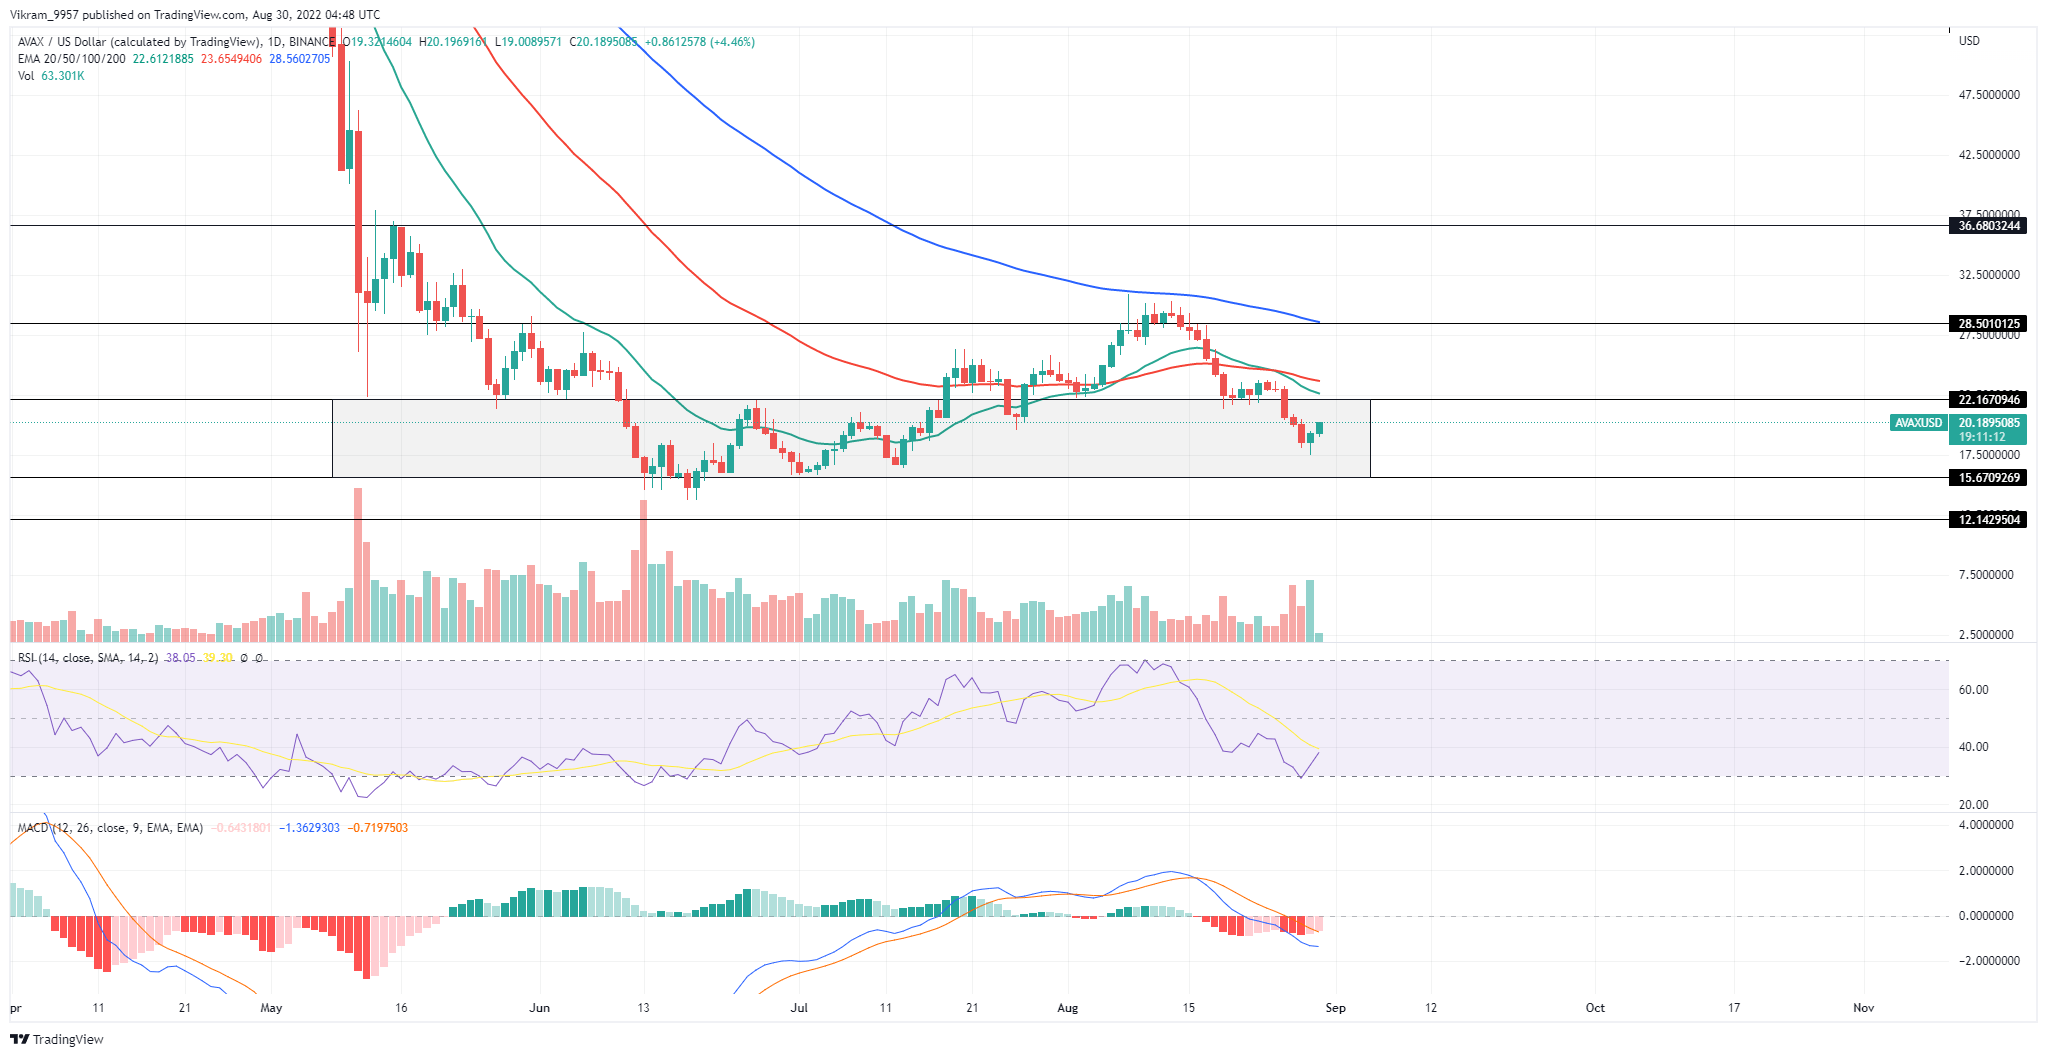
Source — Tradingview
NEAR Technical Analysis
The NEAR prices display a falling trend in the daily chart after facing rejection from the overhead resistance of $6.5. The correction phase drops below the 100 and 50-day EMA, sabotaging the possibility of a bullish crossover. However, the recent increase in buying pressure fuels the bull cycle within the falling wedge, increasing the possibility of a bullish breakout. Furthermore, the hike in the intraday trading volume supports the bullish engulfing candle. If the buying pressure propels the market value above the resistance trendline, the breakout rally can reach the $6 mark. Moreover, the 100-day SMA breakout can jump to the $8 mark. Conversely, reversing from the resistance trendline can result in a price drop to the $3.5 support level.
Technical Indicators
The RSI slope reverses within the nearly oversold zone to cross above the 14-day average line, reflecting an increase in the underlying bullishness. The MACD indicator shows a positive turnaround in the fast line, reflecting the possibility of a crossover event. Furthermore, the declining trend of the negative histograms reflects weakness in the selling pressure. Hence, the technical indicators maintain a positive outlook for the upcoming trend in the NEAR prices. Resistance Levels: $5 and $6 Support Levels: $3.5 and $3


 Bitcoin
  Ethereum
  Tether
  USDC
USDC  Dogecoin
  Cardano
  Bitcoin Cash
  Polygon
  Litecoin
  LEO Token
  OKB
OKB  Stellar
  Cosmos Hub
  Hedera
  Maker
Maker  Algorand
  NEO
NEO  Synthetix Network
  Gate
Gate  KuCoin
  IOTA
IOTA  Tether Gold
  TrueUSD
  Enjin Coin
  0x Protocol
  Ravencoin
  Holo
Holo  Siacoin
  Basic Attention
  Ontology
  Decred
  Zcash
Zcash  Lisk
Lisk  Waves
Waves  DigiByte
  Numeraire
  Status
  Nano
Nano  Pax Dollar
  Steem
Steem  OMG Network
  BUSD
BUSD  Ren
Ren  Bitcoin Diamond
  Bytom
Bytom  HUSD
HUSD  Energi
  Augur
Augur