


Ontology (ONT) Bounces After Falling to All-Time Low
Ontology (ONT) is in the process of breaking out from a horizontal and diagonal resistance levels. If successful, the rate of increase could accelerate greatly.
ONT has been decreasing since reaching an all-time high of $2.95 in May 2021. Since Sept, it has been following a descending resistance line, which led to an all-time low price of $0.19 in June.
While Ontology is still following a descending resistance line, the weekly RSI has already broken out from its resistance. Such breakouts in the RSI often precede breakouts in the price.
If the price manages to break out, the $0.45 area would be expected to provide resistance. This is a crucial area since it had previously provided support since $0.45.
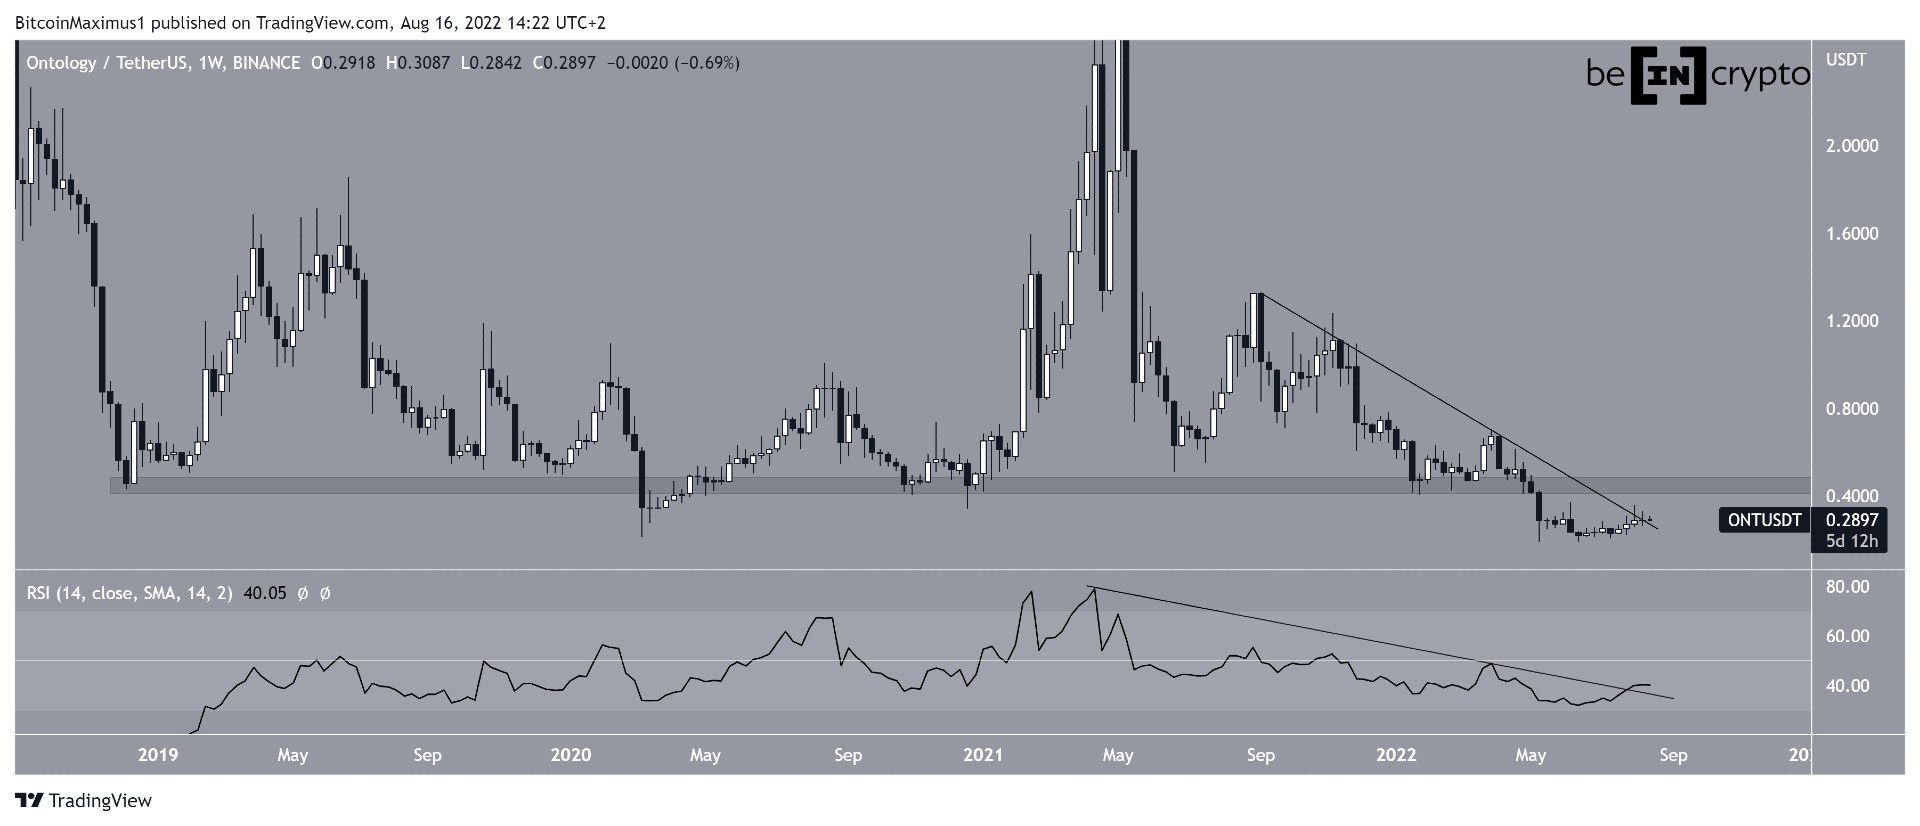
ONT/USDT Chart By TradingView
Cryptocurrency trader @Coinqts tweeted a chart of ONT, stating that it could double in price soon.
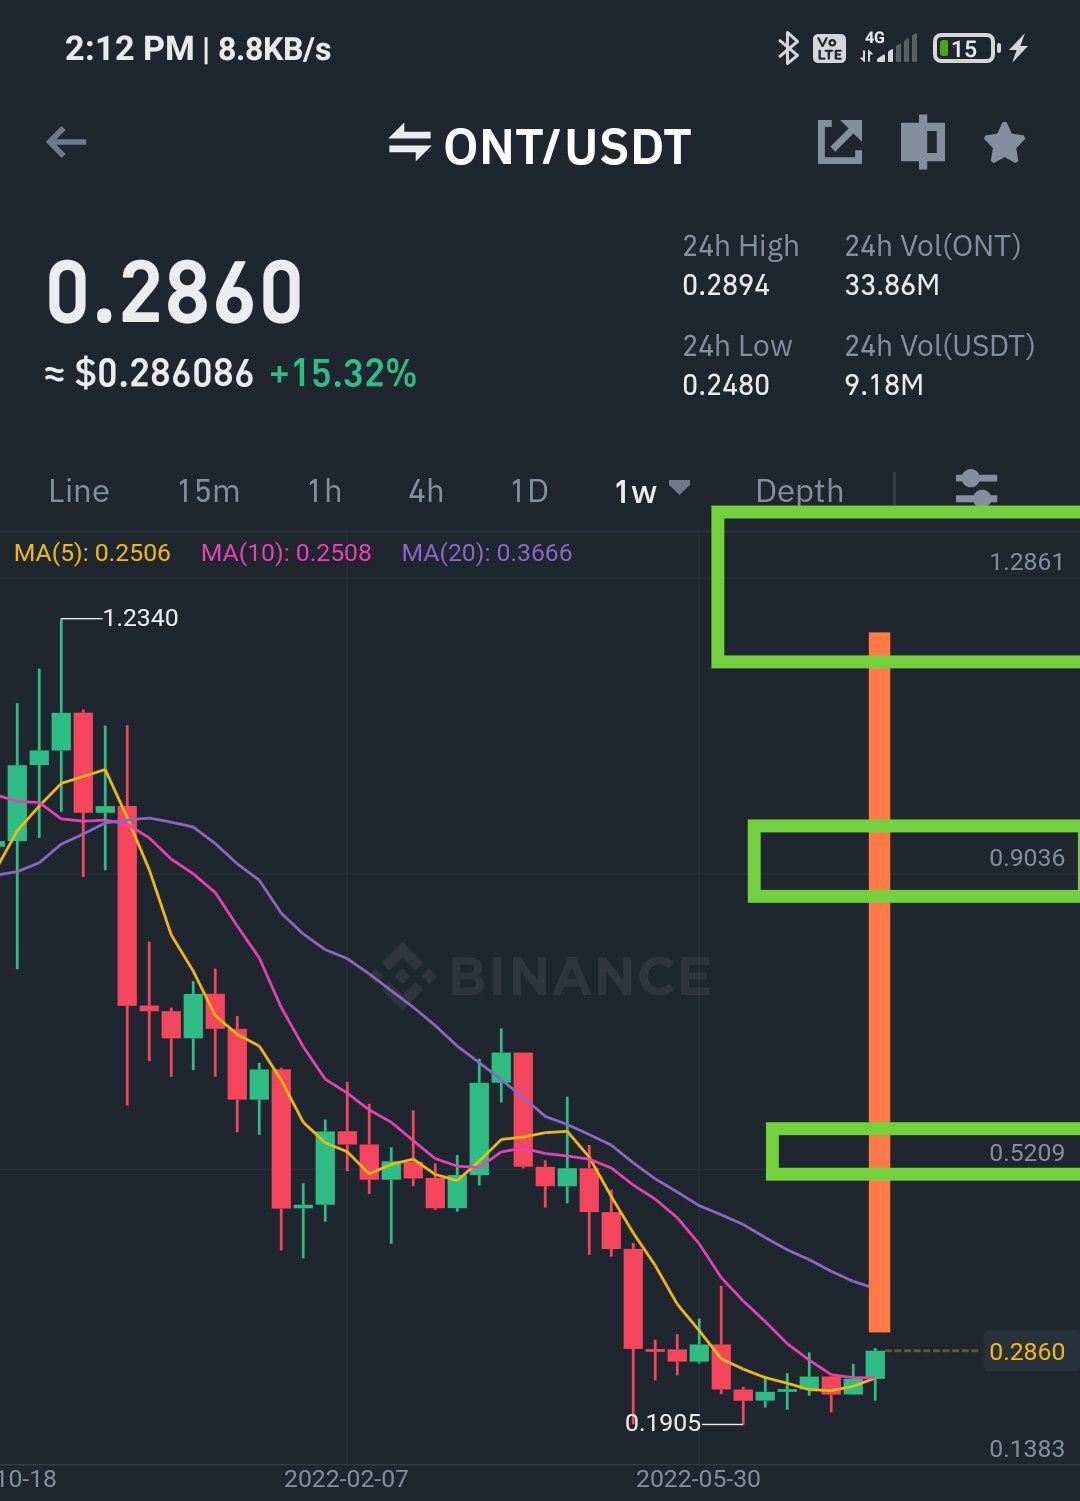
Source: Twitter
If the price manages to break out, it would likely reach the $0.45 area, which is nearly double the current price.
Short-term movement
The daily chart shows that ONT has been trading inside a range between $0.21 and $0.315 since May. More recently, it bounced at the support of the range on and has been increasing since July (green icon). It is currently making an attempt at breaking out.
The daily chart indicates that the most likely scenario is an eventual breakout. The two reasons for this are the fact that the RSI has moved above 50 and that the price has already made several attempts at breaking out.
If a breakout occurs, the closest resistance in the daily timeframe is at $0.48, aligning with the previously outlined long-term resistance.
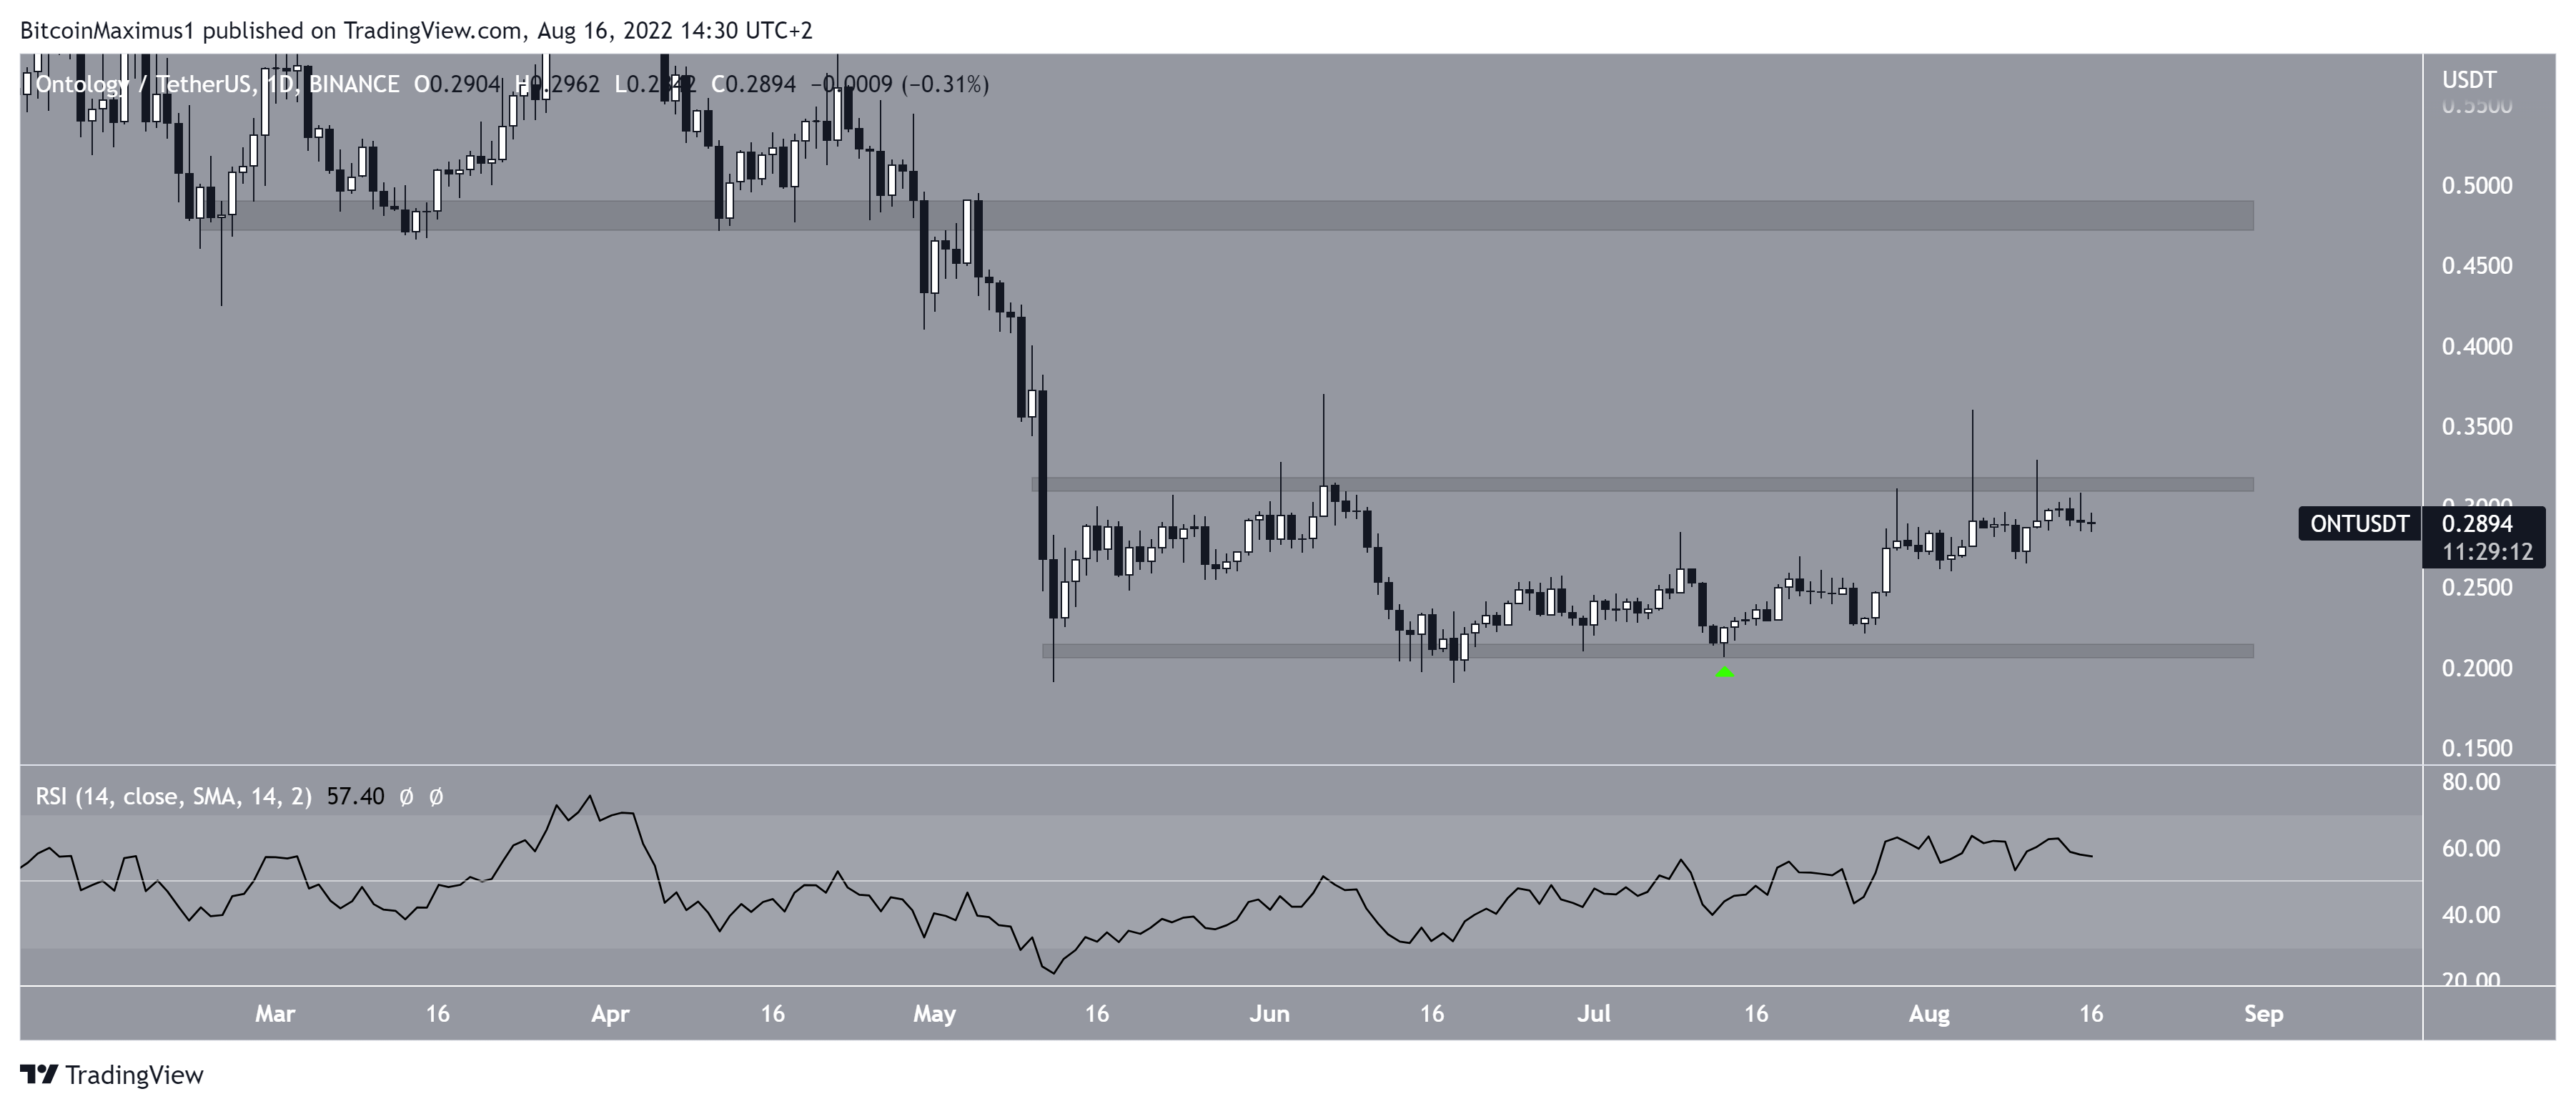
ONT/USDT Chart By TradingView
ONT/BTC
The chart for ONT/BTC is more bullish than the USD counterpart, since the price has already broken out from a descending resistance line. It has currently made four attempts at breaking out from the 1,260 satoshi horizontal resistance area.
If it is successful in breaking out, it could increase rapidly towards 1,900 satoshis.
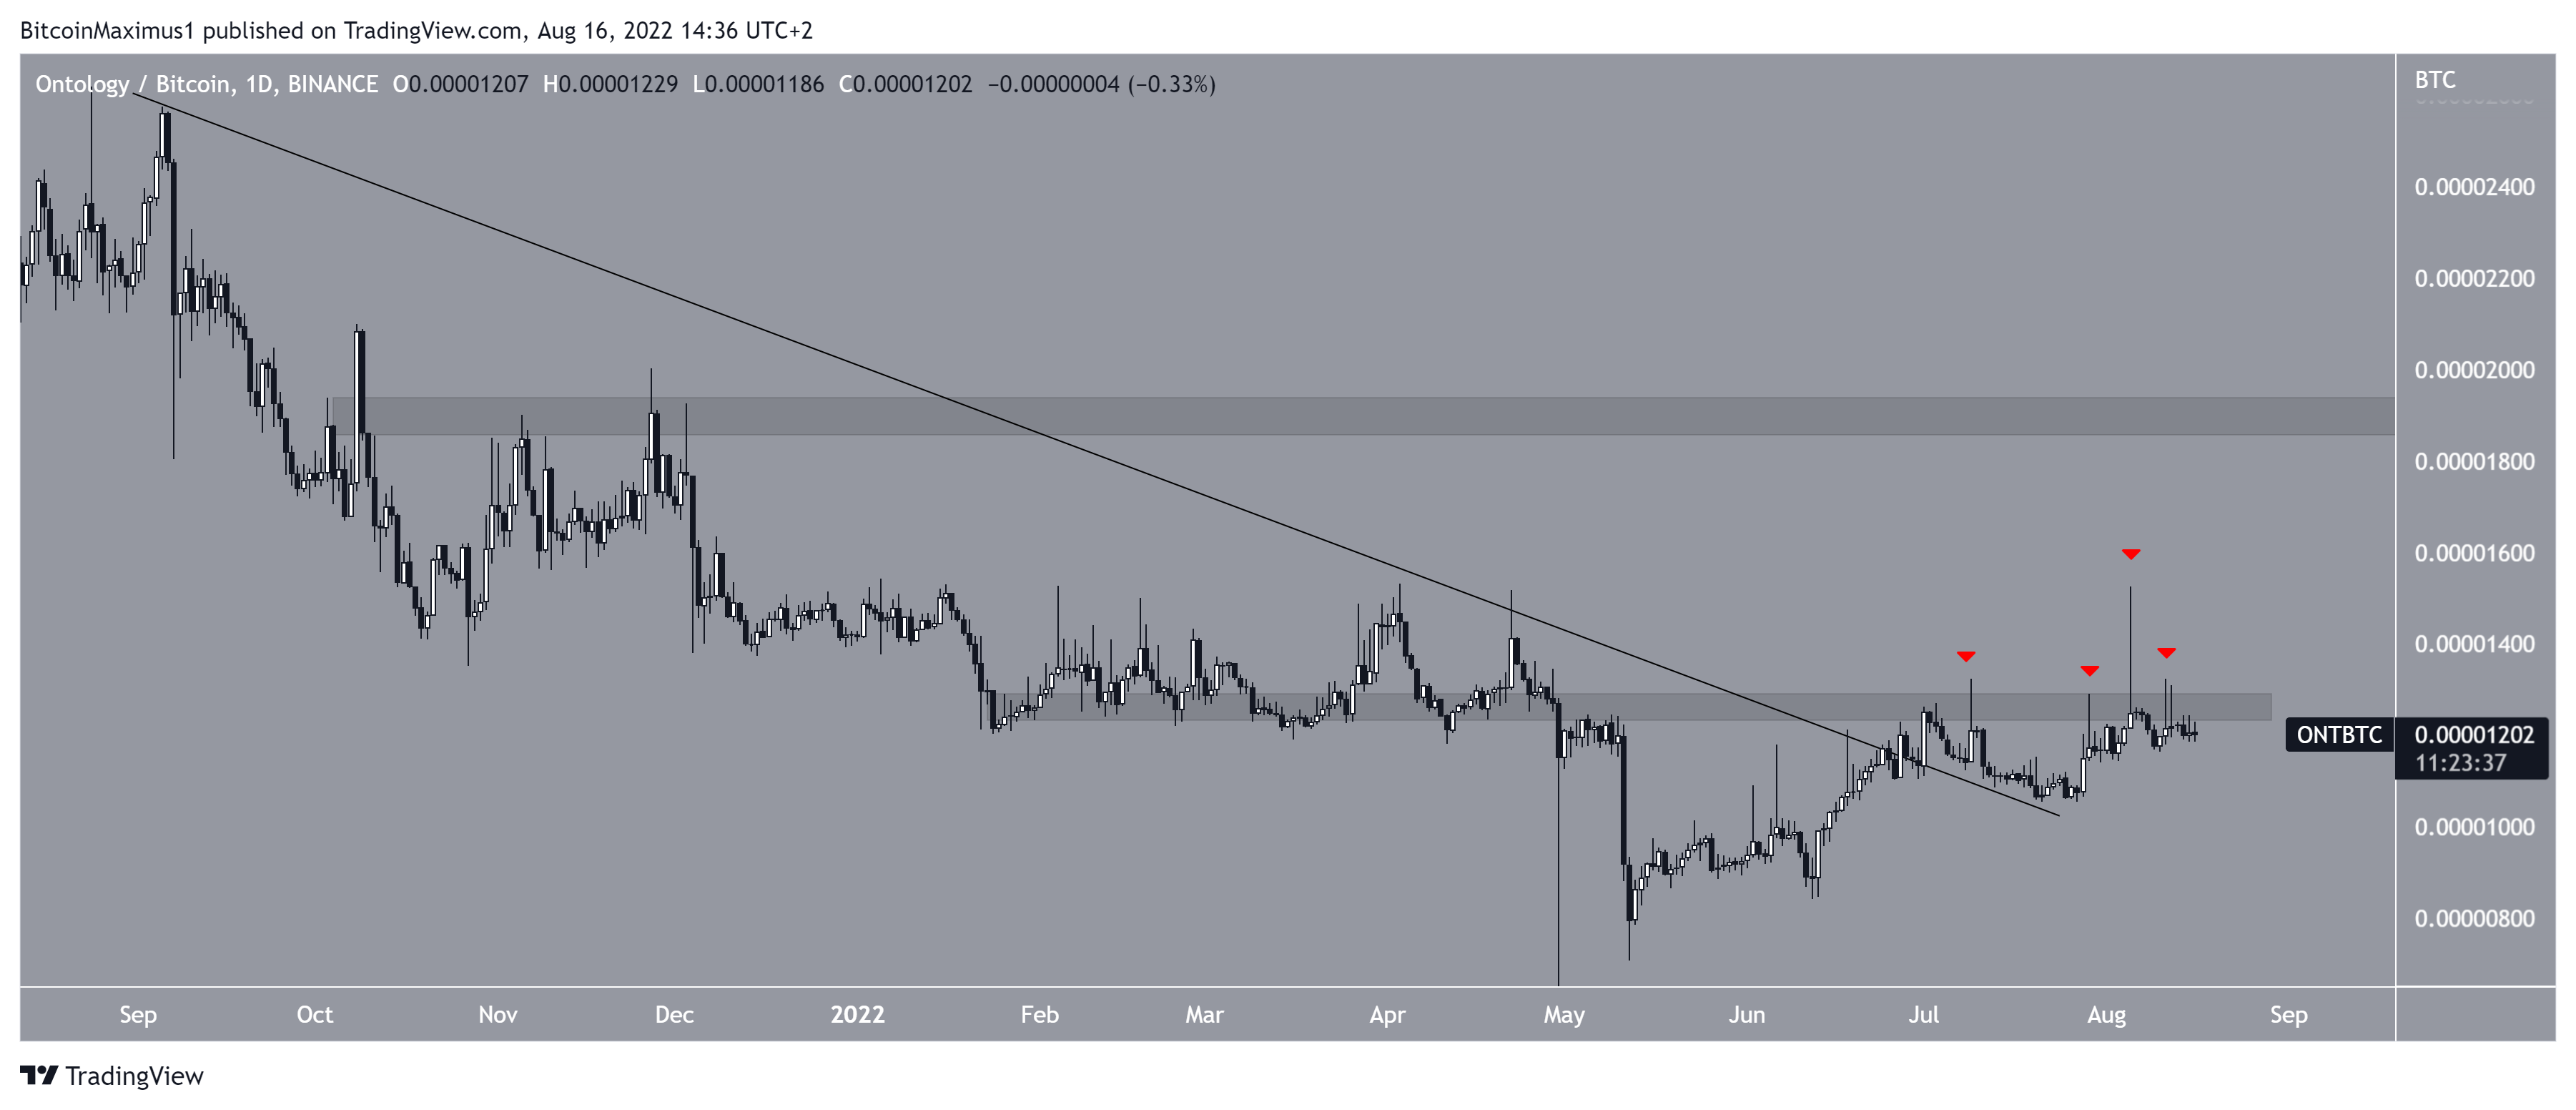
ONT/BTC Chart By TradingView
For Be[in]Crypto’s latest Bitcoin (BTC) analysis, click here


 Bitcoin
  Ethereum
  Tether
  USDC
USDC  Dogecoin
  Cardano
  Bitcoin Cash
  Polygon
  Litecoin
  LEO Token
  Hedera
  Stellar
  Cosmos Hub
  OKB
OKB  Maker
Maker  Algorand
  NEO
NEO  Gate
Gate  Synthetix Network
  KuCoin
  IOTA
IOTA  Tether Gold
  Enjin Coin
  TrueUSD
  Ravencoin
  Holo
Holo  0x Protocol
  Siacoin
  Basic Attention
  Decred
  Ontology
  Zcash
Zcash  Waves
Waves  Lisk
Lisk  DigiByte
  Numeraire
  Status
  Nano
Nano  Steem
Steem  Pax Dollar
  OMG Network
  Ren
Ren  BUSD
BUSD  Bytom
Bytom  Bitcoin Diamond
  HUSD
HUSD  Energi
  Augur
Augur