


Polkadot price analysis: DOT set to face yet another rejection below $1

Polkadot price analysis seems to be turning bearish, as price action over the past 24 hours saw DOT price lower down to $8.55. This change in trend came about after a significant uptrend over the past 3 days that saw Polkadot to rise up to $8.82 from $7.70, recording a 14 percent increment. An evening star pattern can be seen emerging on the daily chart for DOT, which suggests price changing trend. A daily close below support at $7.5 could signal the end of bullish spell for Polkadot and invite more sell offs into the market.
The larger cryptocurrency market showed signs of consolidation over the past 24 hours, as Bitcoin topped up to $23,000 and Ethereum rose past $1,700. Among leading Altcoins, Cardano rose up to $0.51 whereas Ripple jumped up to $0.37. Dogecoin also consolidated around current price at $0.06, whereas Solana moved past the $40 mark with a minor increment.
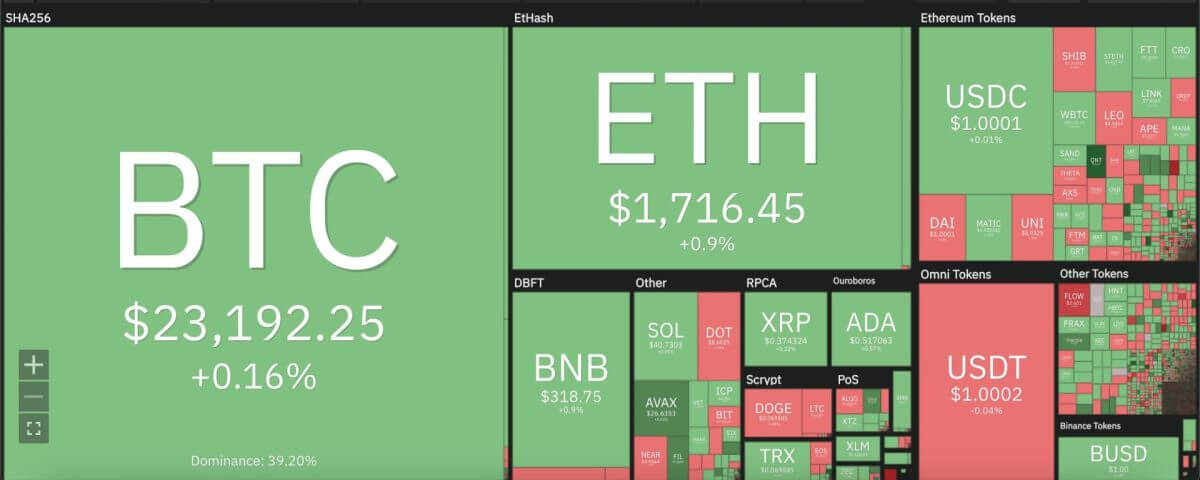
Polkadot price analysis: Cryptocurrency heat map. Source: Coin360
Polkadot price analysis: RSI shows dip in market valuation following 3-day ascent
On the 24-hour candlestick chart for Polkadot price analysis, price can be seen forming an evening star pattern to turn bearish over the past 24 hours. DOT price rose up to $8.85 yesterday but faced yet another rejection below the $1 mark. A similar trend was observed at the end of July 2022, when DOT faced market rejection at $9.09. Price currently remains above the crucial 50-day exponential moving average (EMA) $8.22. However, any movement below support at $7.5 could trigger a further descent for Polkadot.
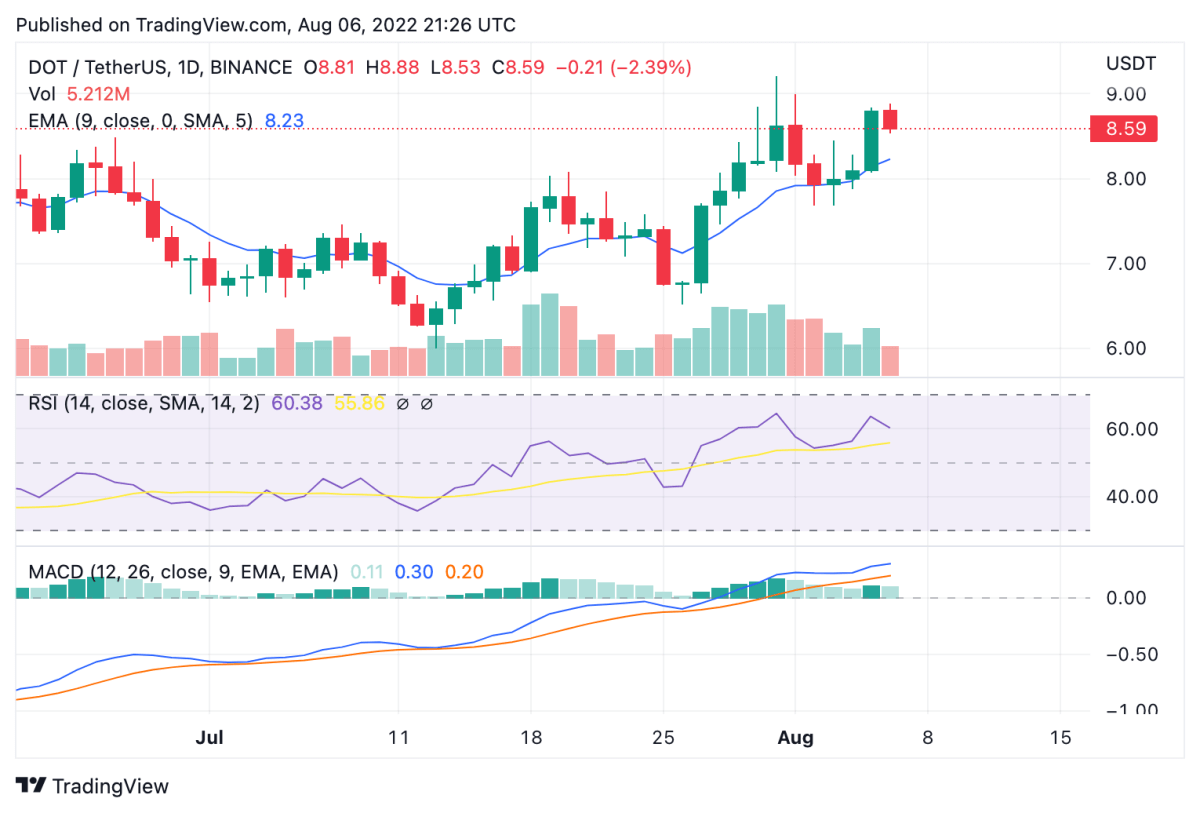
Polkadot price analysis: 24-hour chart. Source: Trading View
The 24-hour relative strength index (RSI) shows a dip in market valuation around the current trend around the 60 mark which also shows price exhaustion into the overbought zone. Trading volume also dropped 12 percent, indicating stagnancy in price creeping into the market. Meanwhile, the moving average convergence divergence (MACD) curve continues to stay above the neutral zone currently but is forming lower highs at current trend.
Disclaimer. The information provided is not trading advice. Cryptopolitan.com holds no liability for any investments made based on the information provided on this page. We strongly recommend independent research and/or consultation with a qualified professional before making any investment decisions.


 Bitcoin
  Ethereum
  Tether
  USDC
USDC  Dogecoin
  Cardano
  Bitcoin Cash
  Polygon
  Litecoin
  LEO Token
  Cosmos Hub
  Stellar
  OKB
OKB  Hedera
  Maker
Maker  Algorand
  NEO
NEO  Gate
Gate  Synthetix Network
  KuCoin
  IOTA
IOTA  Tether Gold
  TrueUSD
  Enjin Coin
  0x Protocol
  Holo
Holo  Ravencoin
  Siacoin
  Ontology
  Basic Attention
  Decred
  Zcash
Zcash  Lisk
Lisk  Waves
Waves  DigiByte
  Numeraire
  Status
  Nano
Nano  Pax Dollar
  Steem
Steem  OMG Network
  BUSD
BUSD  Ren
Ren  Bytom
Bytom  Bitcoin Diamond
  HUSD
HUSD  Energi
  Augur
Augur