


Polkadot price analysis: DOT will need to defend $7 support before moving upwards

Polkadot price analysis shows mixed signals on its daily movement, as price recovered slightly from yesterday’s downtrend that lowered price to $7.09. Over the past 24 hours, DOT regained over 2 percent to move as high as current point at $7.54. However, price still remains in touch with support at $7 and further downtrend is likely once price drops below the 9 and 21-day moving averages. Bulls will look to defend the $7 support before gradually pushing price to the boundary of the $7-$7.5 channel. After the expected downtrend, DOT may be able to conjure up adequate momentum to reclaim $8 in the next push.
The larger cryptocurrency market showed signs of consolidation over the past 24 hours, led by Bitcoin’s move past the $22,500 mark. Ethereum also rose 3 percent to move up to $1,600, whereas leading Altcoins showed similar uptrends. Cardano gained a significant 9 percent to move up to $0.53, while Ripple consolidated up to $0.36 with a minor increment. Dogecoin moved up to $0.068, with Solana gaining 12 percent to move as high as $37.89.
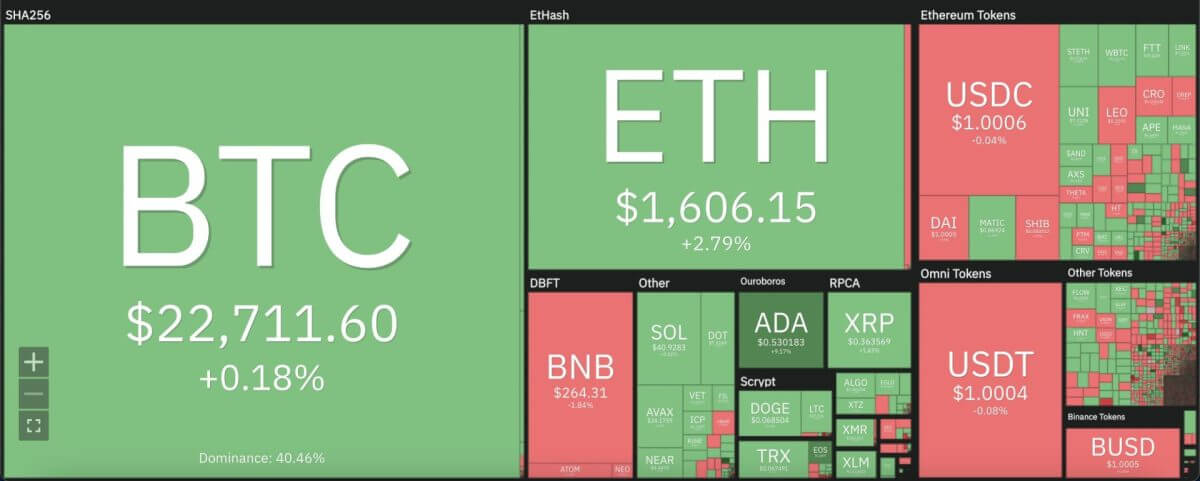
Polkadot price analysis: Cryptocurrency heat map. Source: Coin360
Polkadot price analysis: DOT remains above crucial EMAs on daily chart
On the 24-hour candlestick chart for Polkadot price analysis, price can be seen moving into a horizontal range over the past 5 days since the ascent that started on July 13, 2022. Price moved past the $8 mark on July 19, before correcting down into the current narrow range above $7 support. Price remains above the crucial 50-day exponential moving average (EMA) at $7.32 and above the 21-day moving average at $7.27.
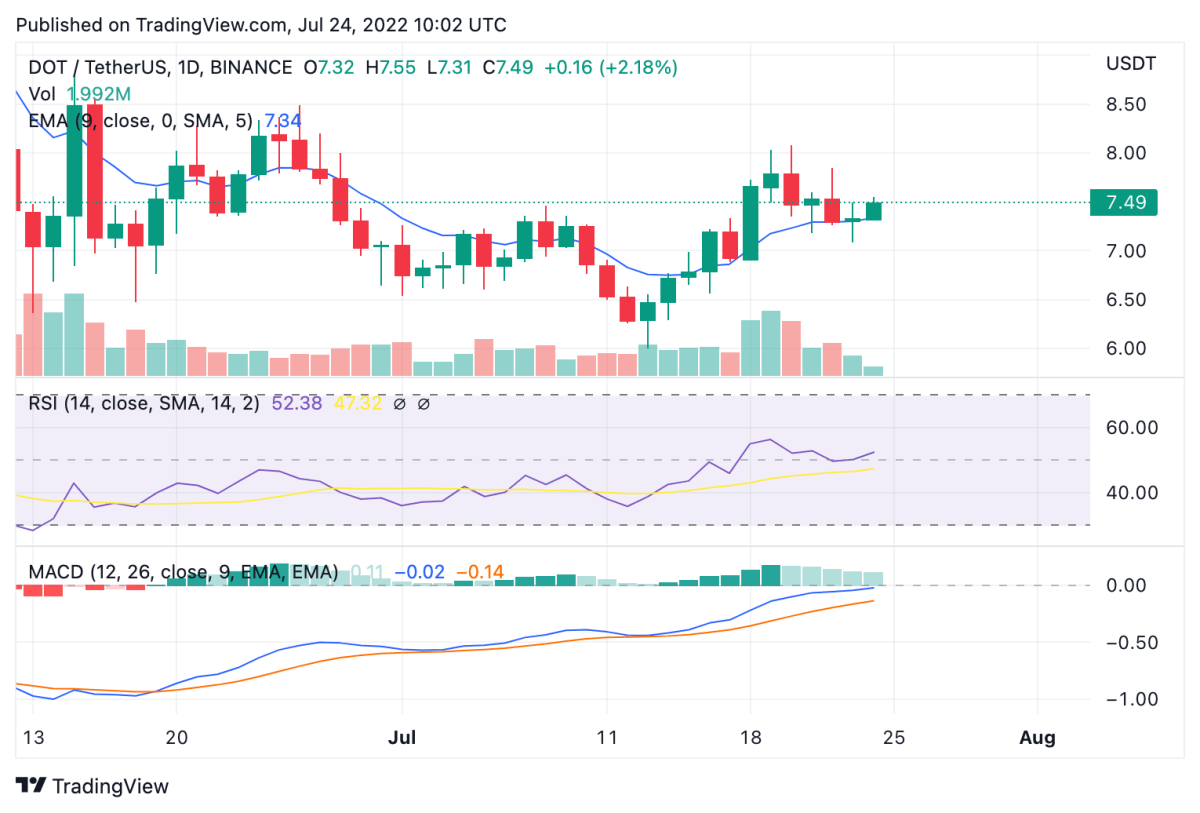
Polkadot price analysis: 24-hour chart. Source: Trading View
The 24-hour relative strength index (RSI) is showing an increased market valuation for DOT at 52.51. Price could be set for correction once the RSI crosses the 60 mark into the overbought zone. However, trading volume over the past 24 hours shows an 8 percent decline to suggest that traders are currently holding the market. The moving average convergence divergence (MACD) curve can be seen forming higher lows above the neutral zone, also showing strength in the market for DOT.
With an increase in buying pressure, DOT price could be in line to push the $8 mark, and then head to further resistance levels at $12 and $13. However, price could move as low as $4 in case of a bearish divergence if Polkadot bulls are unable to hold the market.
Disclaimer. The information provided is not trading advice. Cryptopolitan.com holds no liability for any investments made based on the information provided on this page. We strongly recommend independent research and/or consultation with a qualified professional before making any investment decisions.


 Bitcoin
  Ethereum
  Tether
  USDC
USDC  Dogecoin
  Cardano
  Bitcoin Cash
  Polygon
  Litecoin
  LEO Token
  Cosmos Hub
  Stellar
  OKB
OKB  Hedera
  Maker
Maker  Algorand
  NEO
NEO  Synthetix Network
  Gate
Gate  KuCoin
  IOTA
IOTA  Tether Gold
  TrueUSD
  Enjin Coin
  0x Protocol
  Holo
Holo  Ravencoin
  Siacoin
  Ontology
  Basic Attention
  Decred
  Zcash
Zcash  Lisk
Lisk  Waves
Waves  DigiByte
  Numeraire
  Status
  Nano
Nano  Pax Dollar
  Steem
Steem  OMG Network
  BUSD
BUSD  Ren
Ren  Bytom
Bytom  Bitcoin Diamond
  HUSD
HUSD  Energi
  Augur
Augur