


Polkadot price analysis: Price levels down to $7.84 as bearish pressure still persists

The Polkadot price analysis reveals that a downward movement in DOT/USD price has been observed today, which has cast quite a negative impact on the overall coin value. The price has degraded up to $7.84 value after the bearish trend. Although a constant improvement in price has been recorded till 12 August 2022, the last week has been critical as the coin underwent continuous loss, and the trend is the same for today as the price is sinking downwards.
DOT/USD 1-day price chart: DOT loses 7.11 percent
The 24-hour Polkadot price analysis shows that the cryptocurrency has been facing loss for the past six days. The price is continuing the downtrend today, degrading the cryptocurrency value to $7.84. A loss of 7.11 percent has been recorded during the last 24 hours, and over the past week, a 14 percent loss has been observed in the cryptocurrency value as the trend has been towards the bearish side. The moving average (MA) might go lower than the SMA 50 level, i.e., $8.67, if the declining trend continues. The trading volume has also decreased by 15.15 percent, and the market dominance is 0.80 today.
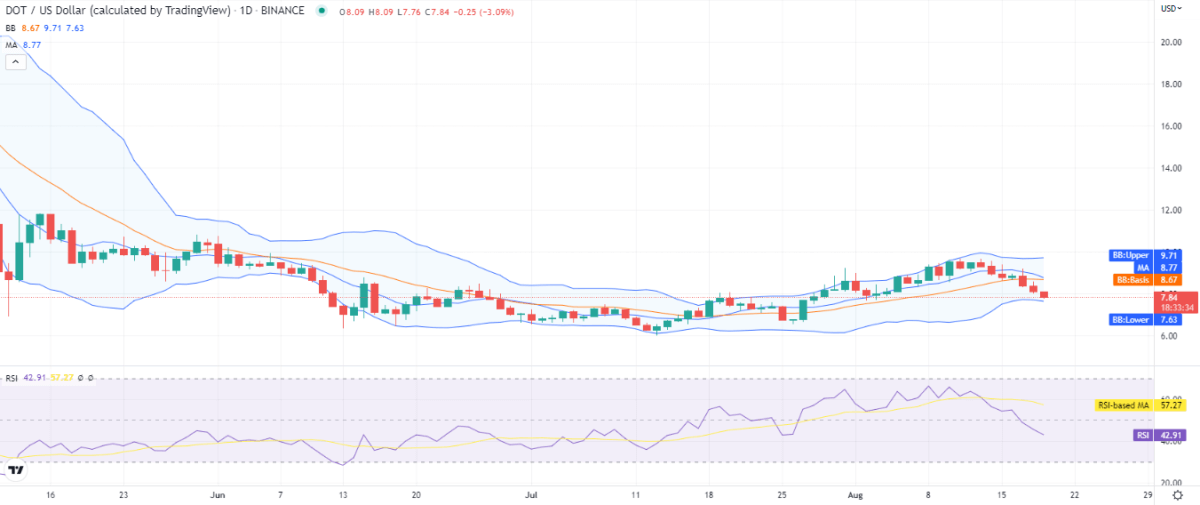
DOT/USD 1-day price chart. Source: TradingView
The volatility was decreased previously, but it seems to be on the increasing side now as the Bollinger bands show signs of diverging. The upper value of the Bollinger bands indicator is now standing at $9.71 point, representing the strongest resistance, whereas the lower value is at $7.63 point representing the strongest support. The Relative Strength Index (RSI) score has reduced to an index of 42 as well as the selling activity is still on the rise.
Polkadot price analysis: Recent developments and further technical indications
The 4-hour price chart for Polkadot price analysis shows the price has covered a steep downward movement in the starting four hours of today’s trading session as the bearish momentum has been trending over the market. The drop in price was quite drastic as the price levels decreased rapidly. However, a slight increase in price has been recorded in the last four hours, and the bulls have succeeded in taking the lead and slightly recovering the price to the $7.85 limit. The price is still below the lower limit of the volatility indicator.
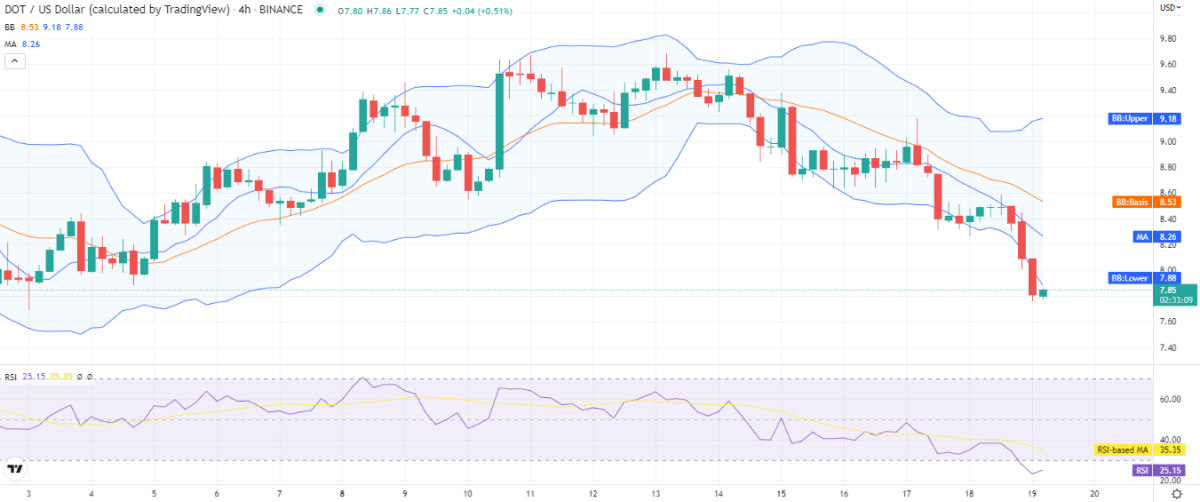
DOT/USD 4-hours price chart. Source: TradingView
The volatility is increasing, and the increase in volatility means that the price might recover to a certain degree in the coming hours. As a consequence, the upper Bollinger band has now moved up to the $9.18 position, whereas the lower Bollinger band has moved down to $7.88. The RSI curve has entered the underbought region, but it has now taken a turn upwards, though the indicator is still trading in the underbought region at index 25, hinting at extreme bearish pressure.
The bulls have been leading the price charts for the past month, but the circumstances changed during the past week if we observe the situation from a general perspective. There is a strong bearish signal for the day as given by the DOT/USD technical indicators as a whole. We can see only two indicators giving out the buy signals, nine indicators on the neutral position, and 15s indicators giving sell signals.
Polkadot price analysis conclusion
The Polkadot price analysis suggests a bearish trend has been observed throughout the day as the price has been reduced to a $7.85 value. The one-day and four hours price charts are predicting a downward trend by giving a lead to the bears. Similar trends are expected in the coming hours as well, as the selling momentum has gotten sharper, but support has also arrived, as is visible on the 4-hour chart; the future trend will depend on the fact if the support can persist or not.
Disclaimer. The information provided is not trading advice. Cryptopolitan.com holds no liability for any investments made based on the information provided on this page. We strongly recommend independent research and/or consultation with a qualified professional before making any investment decisions.


 Bitcoin
  Ethereum
  Tether
  USDC
USDC  Dogecoin
  Cardano
  Bitcoin Cash
  Polygon
  Litecoin
  LEO Token
  Hedera
  Stellar
  Cosmos Hub
  OKB
OKB  Maker
Maker  Algorand
  NEO
NEO  Gate
Gate  KuCoin
  Synthetix Network
  IOTA
IOTA  Tether Gold
  TrueUSD
  Enjin Coin
  Holo
Holo  Ravencoin
  Siacoin
  0x Protocol
  Basic Attention
  Ontology
  Decred
  Zcash
Zcash  Lisk
Lisk  Waves
Waves  DigiByte
  Numeraire
  Status
  Nano
Nano  Pax Dollar
  Steem
Steem  OMG Network
  BUSD
BUSD  Ren
Ren  Bytom
Bytom  Bitcoin Diamond
  HUSD
HUSD  Energi
  Augur
Augur