


Polygon price analysis: MATIC set to regain strength to move towards $1.20

Polygon price analysis is bullish again, after price rose more than 7 percent over the past 24 hours to move as high as $0.8946. MATIC had been in a horizontal channel since July 20, 2022, after initially forming a significant uptrend to move up to $0.98 on July 18. At the start of the sideways pattern, it was expected that seller pressure could recede price down to $0.58 as the coin approached support at $0.77. However, Polygon price has bounced back bullishly to reignite potential for MATIC to move up to $1.20 in the next uptrend. According to bullish technical indicators, price could reach as high as $0.98 over the next 24 hours.
The larger cryptocurrency market also shows bullish signs to mimic Polygon’s uptrend, led by Bitcoin’s move up to $23,000 with a 3 percent increase. Ethereum follows suit, rising 7 percent to move up to $1,600, whereas leading Altcoins also show strength across the board. Cardano made a significant jump worth 9 percent today to move as high as $0.52, while Ripple moved up to $0.36 with a 3 percent increment. Dogecoin also rose 3 percent up to $0.06, the same as Solana’s move up to $41.06. Meanwhile, Polkadot jumped 4 percent to sit at $7.45.
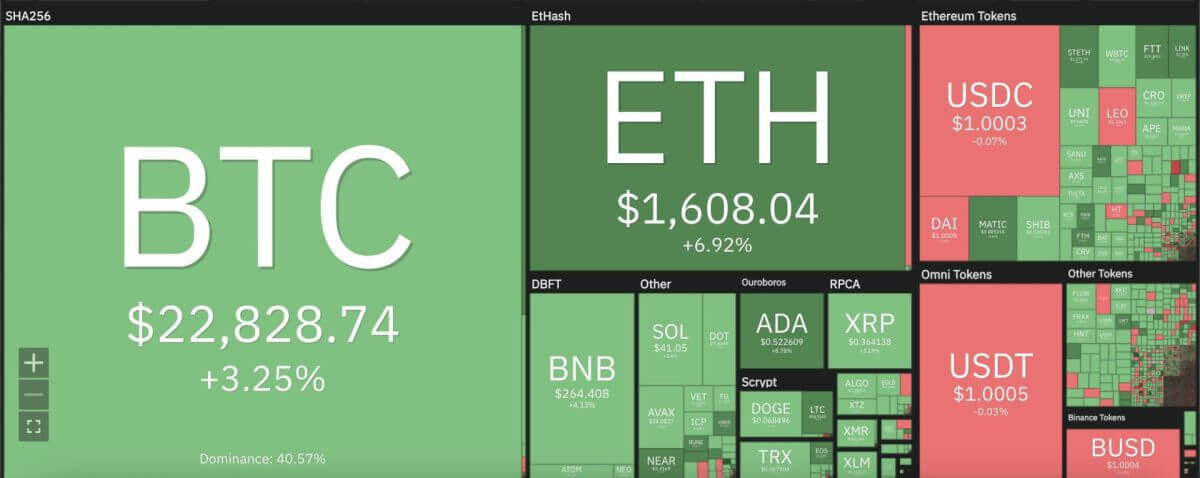
Polygon price analysis: Cryptocurrency heat map. Source: Coin360
Polygon price analysis: MATIC RSI goes into overbought zone on daily chart
On the 24-hour candlestick chart for Polygon price analysis, price can be seen underway to begin another ascent after an extended period sideways. MATIC price had been in decline since July 19, 2022, after initially undergoing a massive 80 percent increment in the previous week. Price rose as high as $0.98 back then, then falling back into a rectangular pattern between $0.85 and $0.90. Over the past 24 hours, Polygon price amassed over 7 percent to move as high as $0.90, as price rose above the crucial 50-day exponential moving average (EMA) at $0.84 in the process.
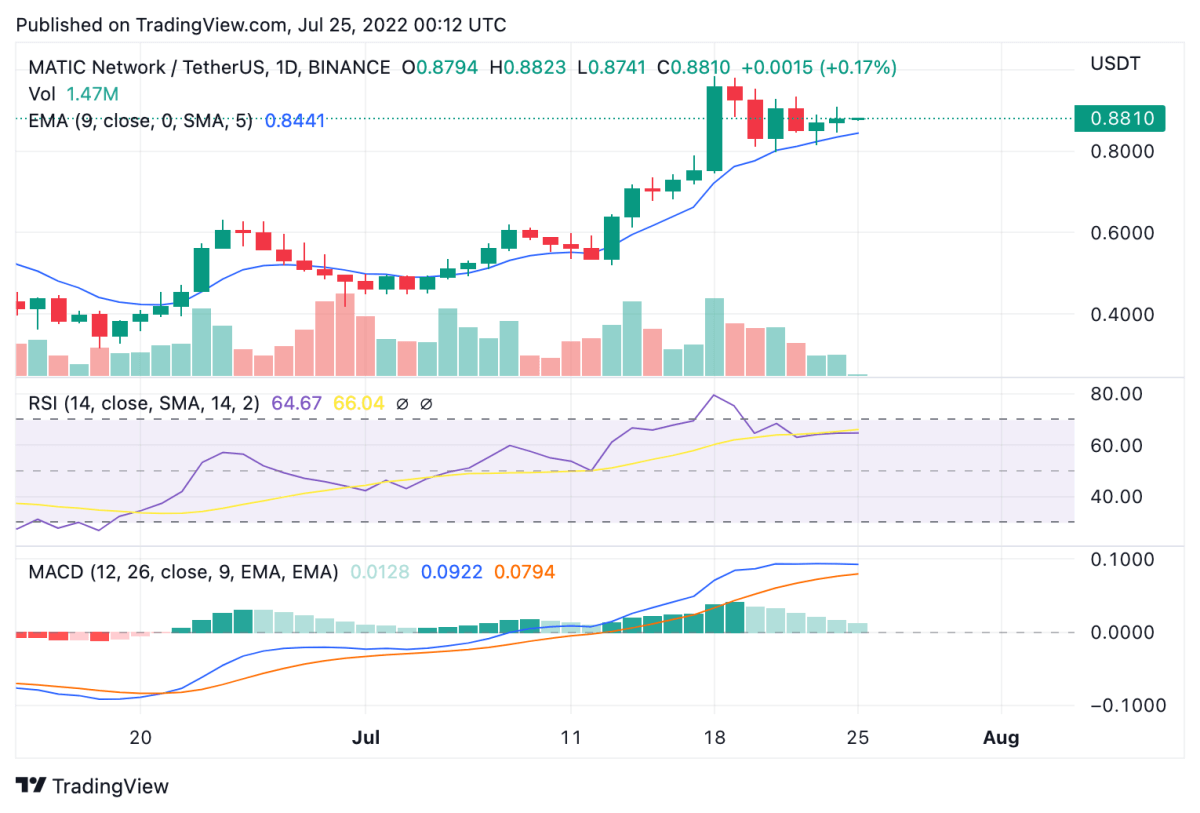
Polygon price analysis: 24-hour chart. Source: Trading View
However, the 24-hour relative strength index (RSI) presents a problematic view after jumping into deep overbought territory at 64.56. Trading volume also jumped more than 5 percent over the past 24 hours, suggesting it may be time for a correction in price. Meanwhile, the moving average convergence divergence (MACD) curve can be seen forming lower highs above the neutral zone, and a bearish divergence is expected over the coming trading sessions.
Disclaimer. The information provided is not trading advice. Cryptopolitan.com holds no liability for any investments made based on the information provided on this page. We strongly recommend independent research and/or consultation with a qualified professional before making any investment decisions.


 Bitcoin
  Ethereum
  Tether
  USDC
USDC  Dogecoin
  Cardano
  Bitcoin Cash
  Polygon
  Litecoin
  LEO Token
  OKB
OKB  Cosmos Hub
  Stellar
  Maker
Maker  Hedera
  Algorand
  NEO
NEO  Synthetix Network
  Gate
Gate  KuCoin
  IOTA
IOTA  Tether Gold
  TrueUSD
  Enjin Coin
  0x Protocol
  Ravencoin
  Siacoin
  Holo
Holo  Basic Attention
  Zcash
Zcash  Decred
  Ontology
  Waves
Waves  Lisk
Lisk  DigiByte
  Numeraire
  Status
  Nano
Nano  Pax Dollar
  Steem
Steem  OMG Network
  BUSD
BUSD  Ren
Ren  Bitcoin Diamond
  Bytom
Bytom  HUSD
HUSD  Energi
  Augur
Augur