


QNT Technical Analysis: Will This Golden Crossover Boost Quant Prices?

The QNT Technical Analysis shows a rounding bottom reversal from the support trendline giving a bullish breakout of $133. The QNT price action shows a bullish reversal from the ascending trendline, crossing the previous swing high at $133. Moreover, the price action offers a breakout entry opportunity for Quant buyers as the bulls break a rounding bottom pattern. However, the higher price rejection in the daily chart questions the uptrend sustenance.
Key Points:
- The Quant price action shows the $133 breakout.
- The higher price rejection candle warns of a reversal.
- The intraday trading volume in Quant is $205 million.
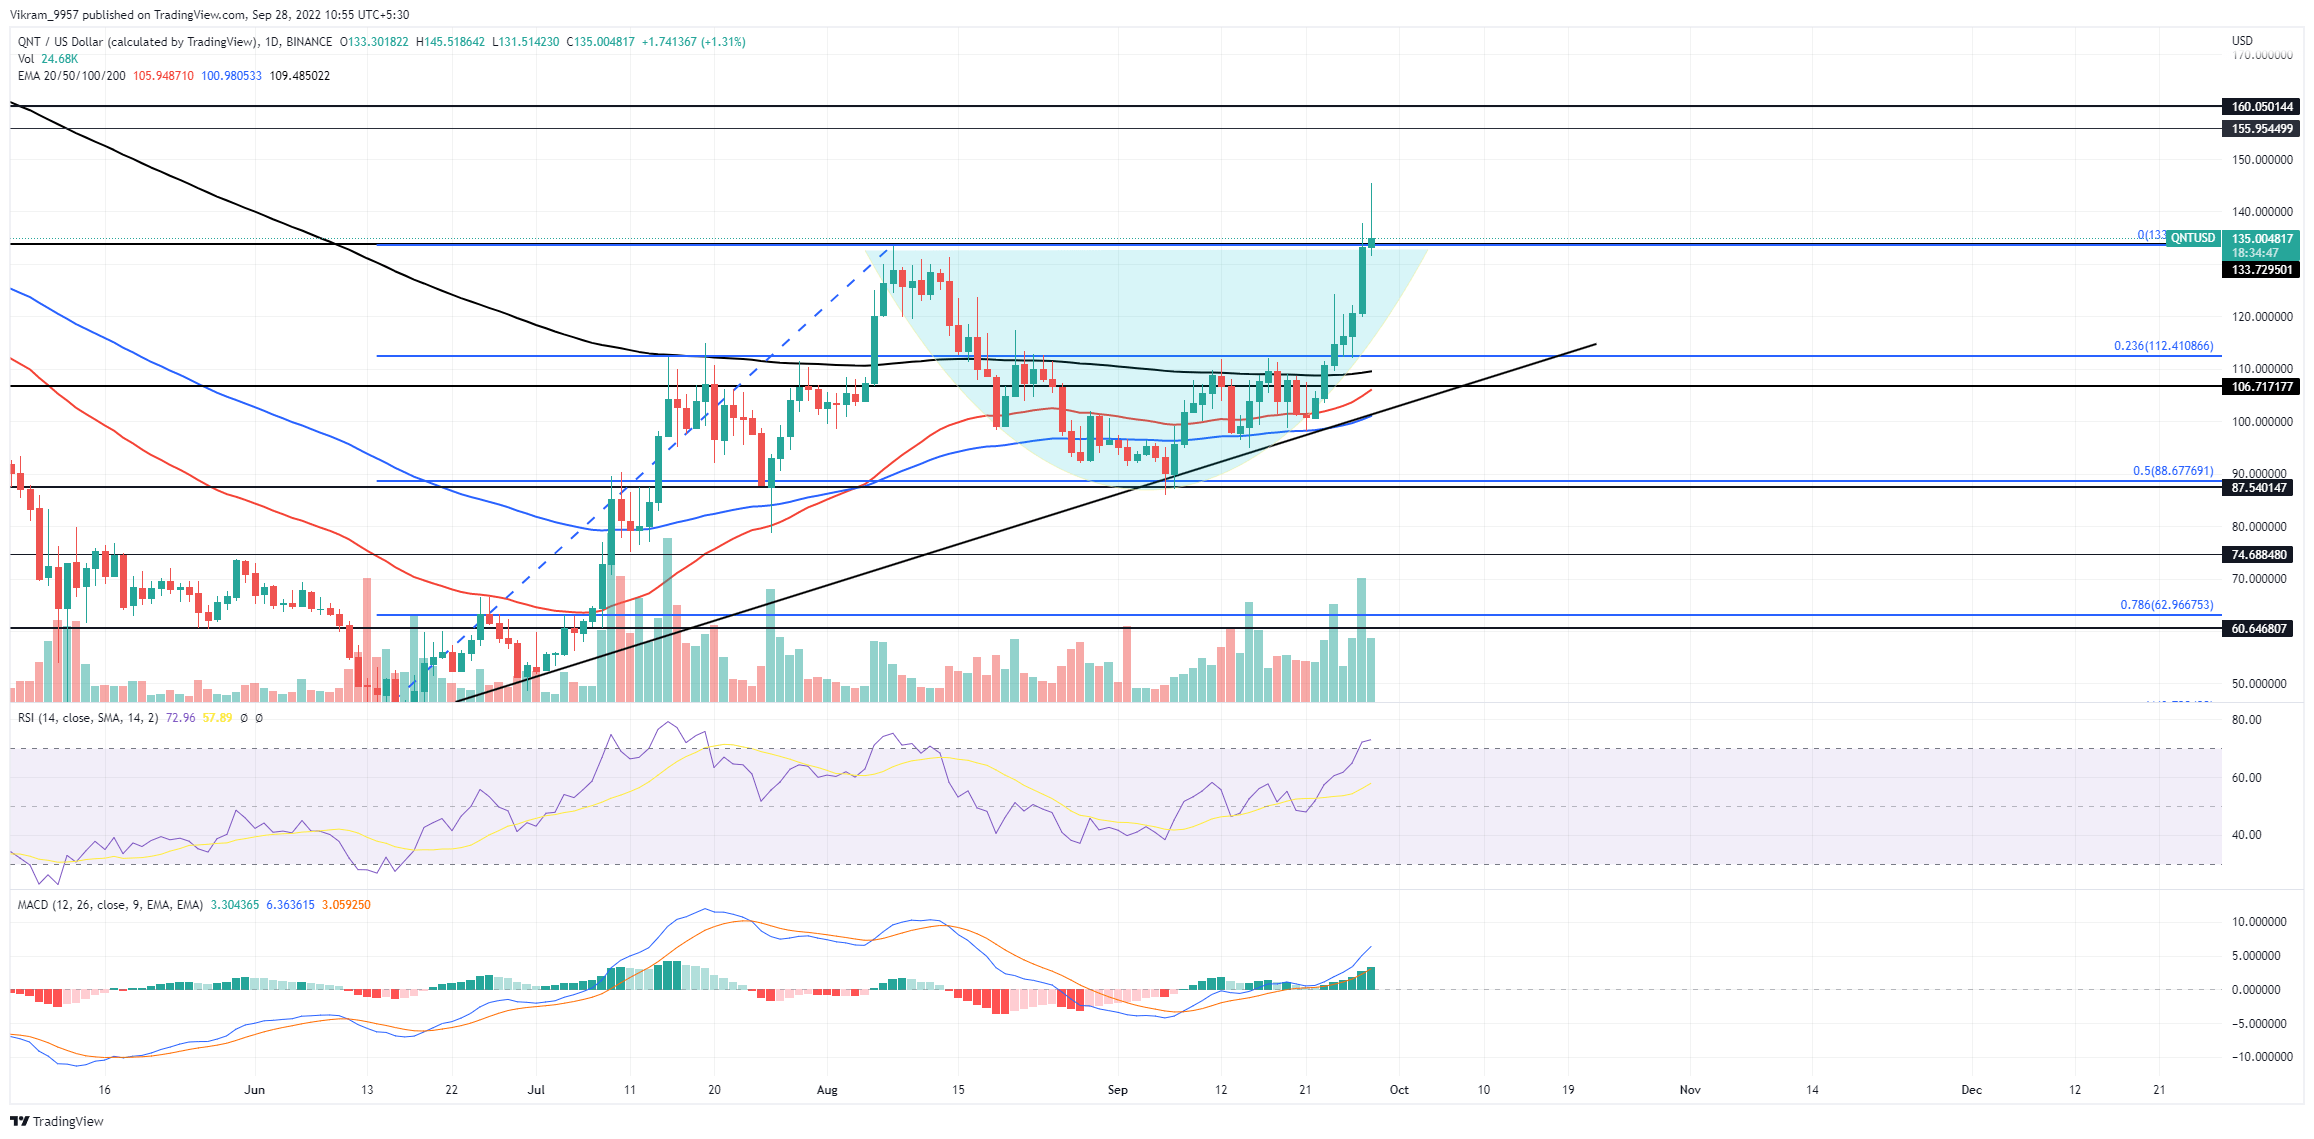
Source — TradingView
QNT Technical Analysis
As mentioned in our previous analysis, the QNT price action avoids a head and shoulder pattern displaying the buyers beating the bearish pressure. The market value breaks the $110 mark, nullifying the bearish pattern. The breakout rally propels the QNT price by 21% in the last five days, creating a streak of bullish candles. Moreover, the Quant price action displays a rounding bottom pattern breakout as the uptrend exceeds the $133 neckline. Additionally, the high momentum uptrend increases bullish influence over the crucial daily EMAs resulting in a positive uptrend. Hence, the possibility of a golden crossover increases in the daily chart. This prominent reversal rally comes after a sharp increase in buying pressure at the support trendline. Hence, any future correction to the support trendline can signal a buying opportunity for sideline traders. Coming back to the present times, the lack of bullish follow-through in the daily candle results in higher price rejection, questioning the breakout credibility. If the candle fails to close above the neckline ($133), the Quant price may drop back to the $112 mark. Optimistically, if the buying pressure sustains, the QNT market price will cross the psychological mark of $150 to test sellers at $160.
Technical Indicators
The RSI slope shows a rising trend above the overbought boundary with the support of the 14 days average line. Moreover, the MACD and signal lines display an increasing bullish spread, fueling the positive trend in histograms. Therefore, the technical indicators reflect a rising trend in buying pressure. As a result, the QNT technical analysis takes an optimistic standpoint and offers a buying opportunity upon breakout. Resistance Levels — $150 and $160 Support Levels — $133 and $112


 Bitcoin
  Ethereum
  Tether
  USDC
USDC  Dogecoin
  Cardano
  Bitcoin Cash
  Polygon
  Litecoin
  LEO Token
  Hedera
  Stellar
  Cosmos Hub
  OKB
OKB  Maker
Maker  Algorand
  NEO
NEO  Gate
Gate  KuCoin
  Synthetix Network
  IOTA
IOTA  Tether Gold
  TrueUSD
  Enjin Coin
  Ravencoin
  Holo
Holo  Siacoin
  0x Protocol
  Basic Attention
  Ontology
  Decred
  Zcash
Zcash  Lisk
Lisk  Waves
Waves  DigiByte
  Numeraire
  Status
  Nano
Nano  Pax Dollar
  Steem
Steem  OMG Network
  BUSD
BUSD  Ren
Ren  Bytom
Bytom  Bitcoin Diamond
  HUSD
HUSD  Energi
  Augur
Augur