


Reserve Rights (RSR) Bounces After Falling To New All-Time Low

Reserve Rights (RSR) has been moving upwards since its May 12 bottom, but has yet to reclaim the previous all-time low support level.
RSR has been decreasing underneath a descending resistance line since April 2021. The downward movement led to a new all-time low price of $0.003 in May 2022.
The price has been moving upwards since and managed to break out from the line in the beginning of June. However, despite the breakout, it has failed to initiate any sort of sustained upward movement.
To the contrary, the price is still trading below the $0.0095 resistance area, which previously acted as the all-time low bottom.
Additionally, the weekly RSI is below 50, in what is also considered a sign of a bearish trend.
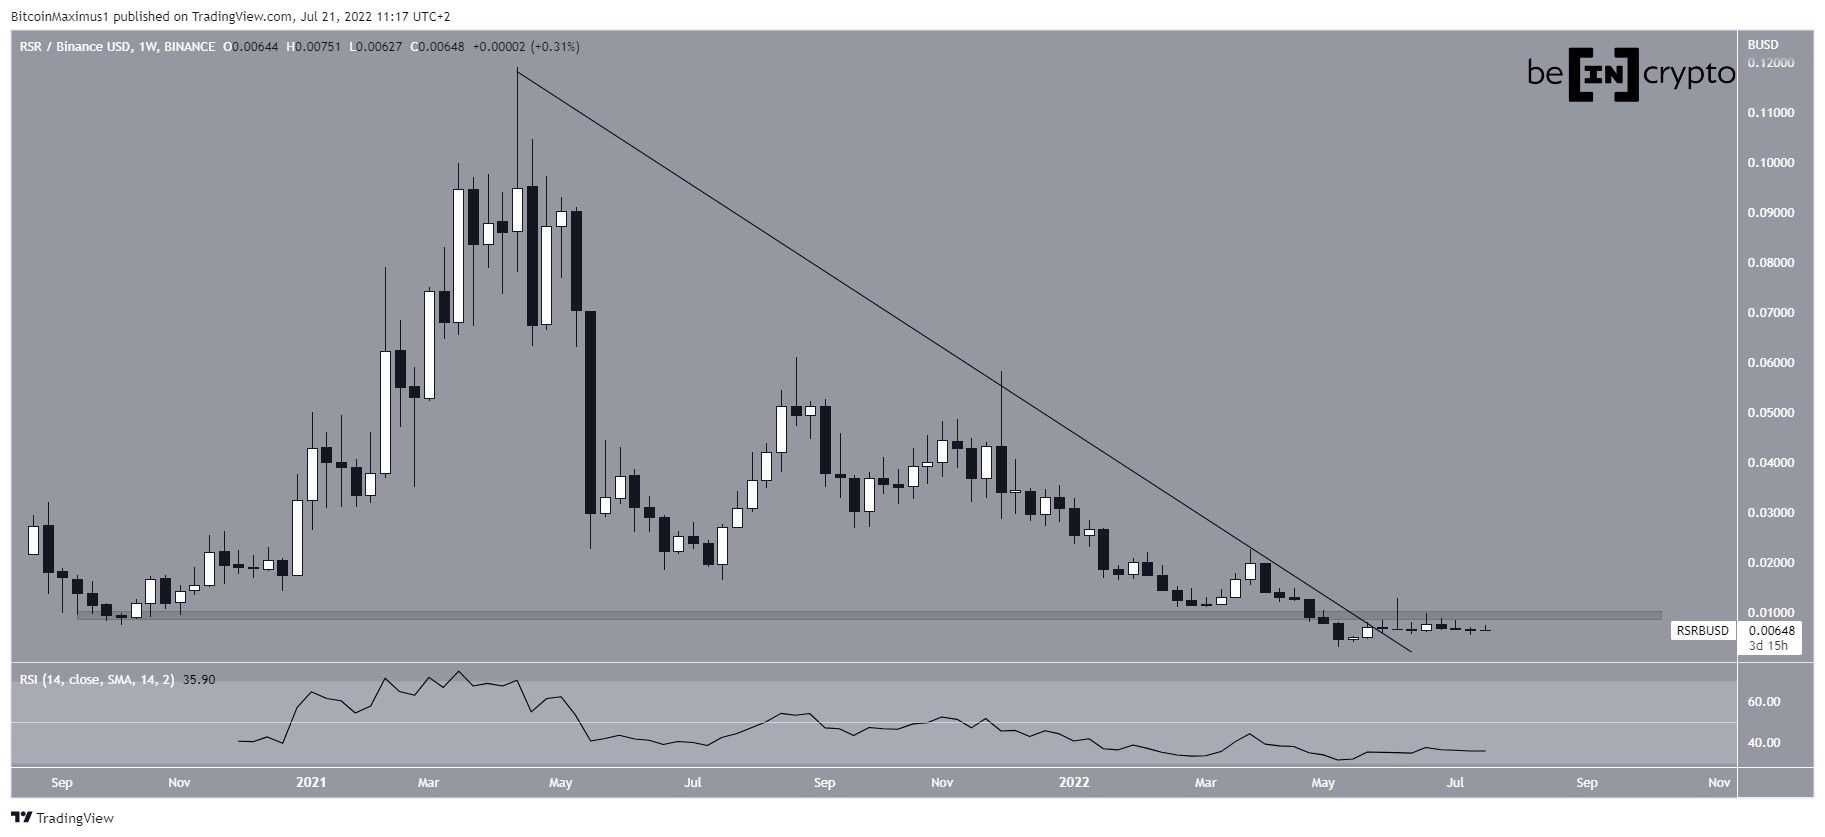
RSR/BUSD Chart By TradingView
Failed attempt at upward movement
The daily chart shows that the upward movement after the May 12 bottom followed an ascending support line. While it led to a high of $0.013, RSR created a long upper wick after it was rejected by the $0.0114 resistance area (red icon).
Afterward, the downward movement caused a breakdown from the aforementioned ascending support line and its validation as resistance.
Moreover, the daily RSI is below 50 in what is considered a sign of a bearish trend.
So, the daily time frame does not provide any signs for a potential bullish trend reversal.
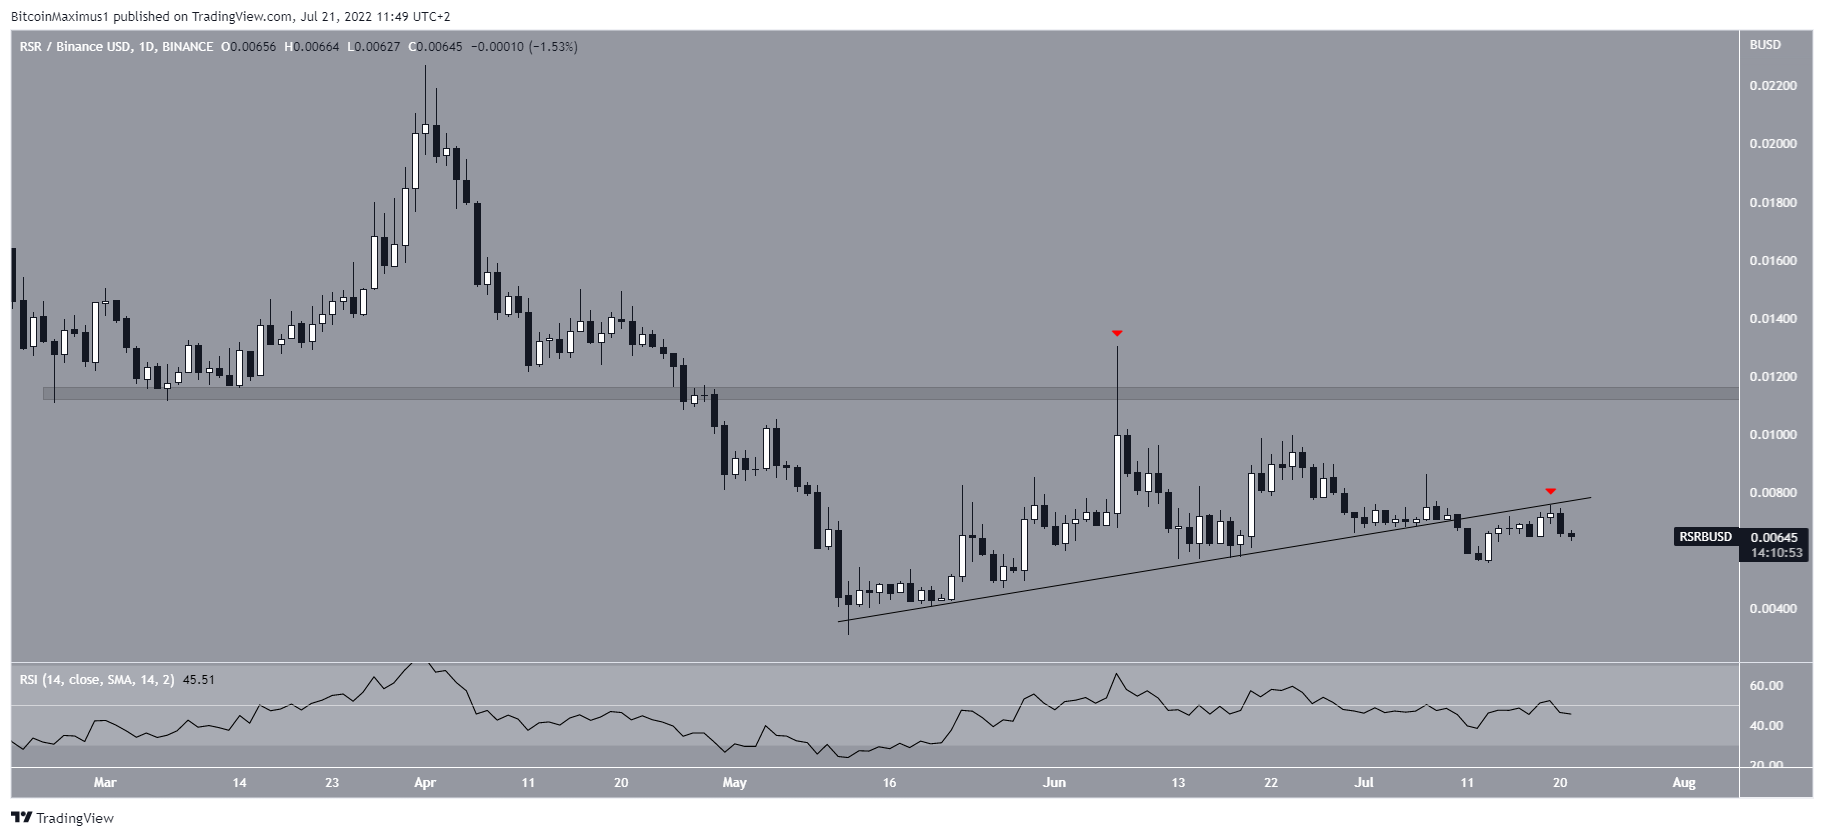
RSR/BUSD Chart By TradingView
RSR wave count analysis
Cryptocurrency trader @TheTradingHubb tweeted a chart of RSR, stating that the price has completed a five-wave upward movement and another one could follow soon.
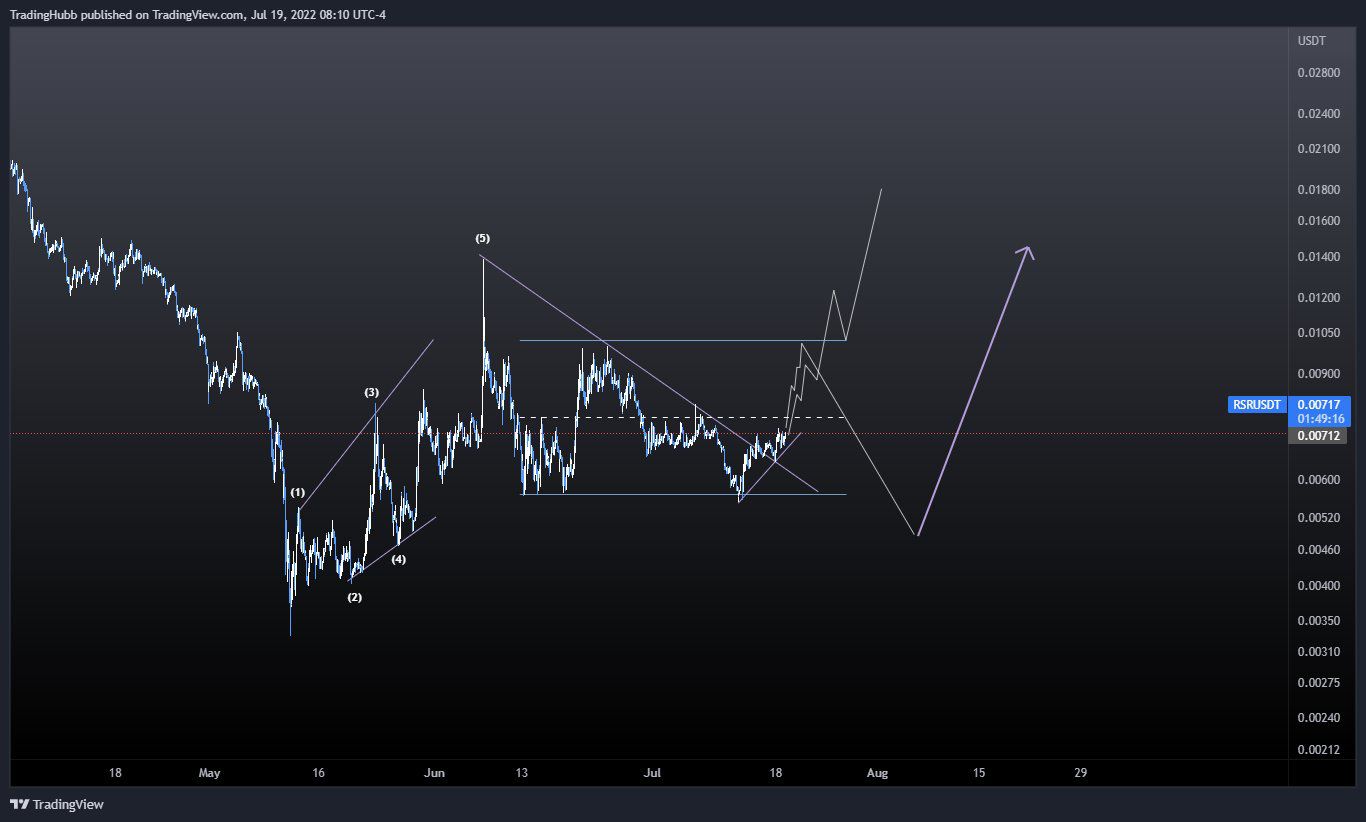
Source: Twitter
Unlike the weekly and daily charts, the wave count provides a more bullish outlook. The reason for this is that the increase after the May 12 bottom is a five-wave structure, while the ensuing decrease is an A-B-C corrective structure.
If the wave C low (red line) of $0.0055 holds, the price could resume its upward movement. However, a decrease below that level would indicate that new lows are in store.
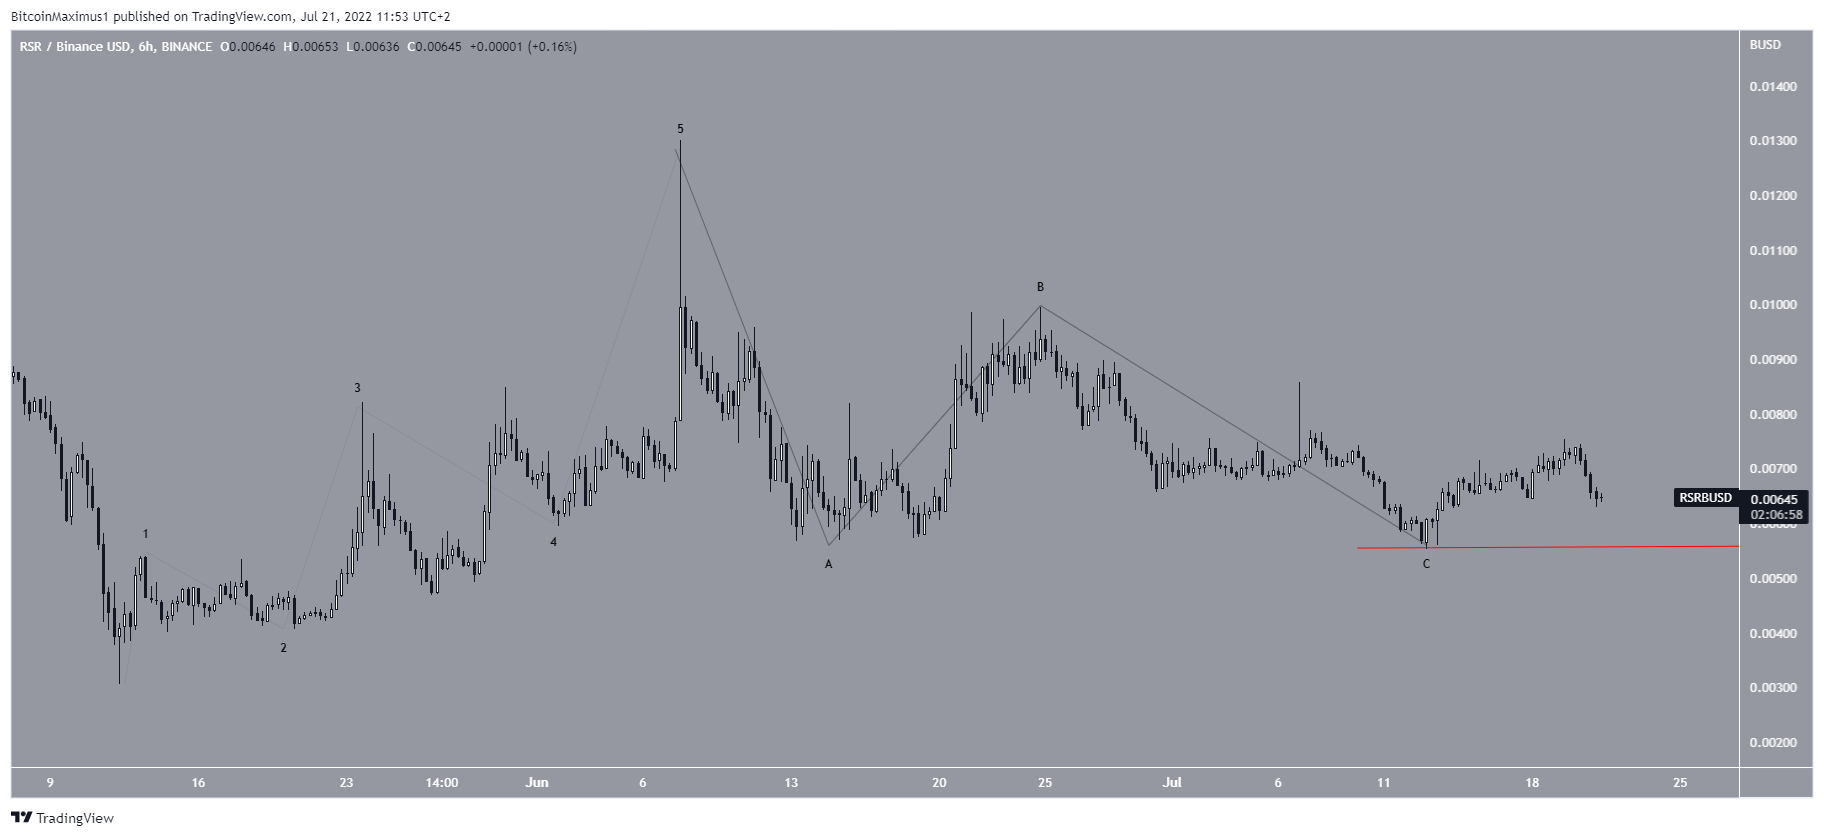
RSR/BUSD Chart By TradingView
For Be[in]Crypto’s latest Bitcoin (BTC) analysis,click here


 Bitcoin
  Ethereum
  Tether
  USDC
USDC  Dogecoin
  Cardano
  Bitcoin Cash
  Polygon
  Litecoin
  LEO Token
  OKB
OKB  Cosmos Hub
  Stellar
  Hedera
  Maker
Maker  Algorand
  NEO
NEO  Synthetix Network
  Gate
Gate  KuCoin
  IOTA
IOTA  Tether Gold
  TrueUSD
  Enjin Coin
  0x Protocol
  Ravencoin
  Holo
Holo  Siacoin
  Basic Attention
  Decred
  Zcash
Zcash  Ontology
  Waves
Waves  Lisk
Lisk  DigiByte
  Numeraire
  Status
  Nano
Nano  Pax Dollar
  Steem
Steem  OMG Network
  BUSD
BUSD  Ren
Ren  Bitcoin Diamond
  Bytom
Bytom  HUSD
HUSD  Energi
  Augur
Augur