


SANDBOX Price Analysis: The SAND Price is Back on Recover

- The SAND price has begun to recover over the daily price chart, although the entire market is declining due to BTC dominance.
- The crypto asset is trading above the 20, 50, 100 and 200 day moving average over the hourly price chart.
- The SAND/BTC pair is at 0.00006008 BTC with a gain of 2.46%.
A blockchain-based virtual world called The Sandbox lets users create, produce, purchase, and trade digital goods in the form of games. The Sandbox develops a decentralized platform for a successful gaming community by fusing the strengths of DAO and NFTs.
Where the whole market is sinking amid the BTC domination, here the SAND price has started recovering over the daily price chart. The SAND price started sinking, but the SAND bulls came at the right time to support the token and save their previous efforts in making the token recover. The recovery is very small but it is a sign of relief for the investors. The trading volume is moving below the average and it looks like the bulls are working on it.
The current price for one SAND token is moving at $1.36 and it is at a loss of 3.94% in its market capitalization in the 24 hrs. The token has a trading volume of 559 million which is at a loss of 9.18% over the intraday trading session and has a market cap of 1.7 billion. The volume market cap ratio for SAND is 0.3289.
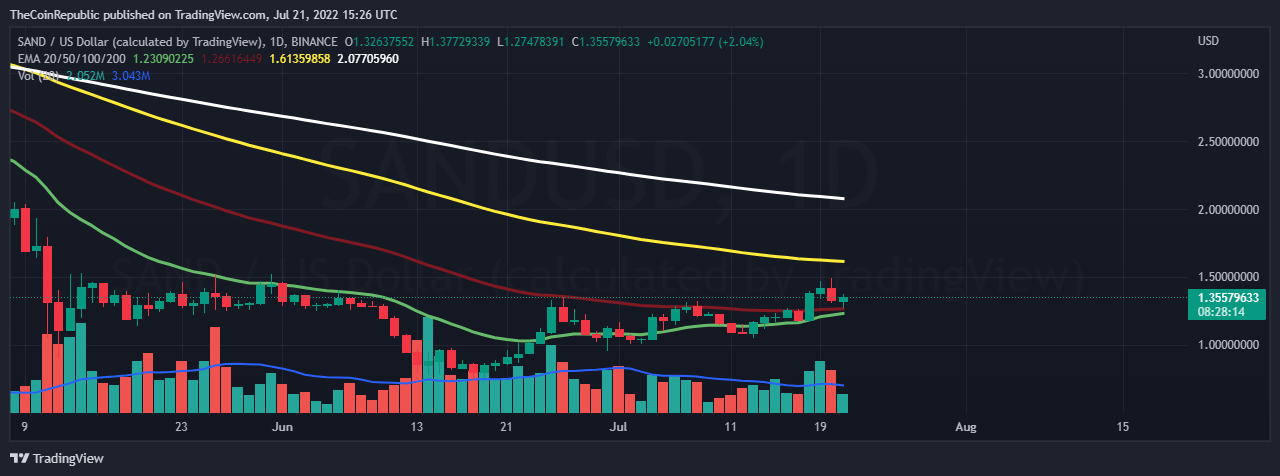
Source: SAND/USD by tradingview
Short-term Analysis
While observing the chart for a short term (4 hrs) we can observe the initiation of an uptrend movement after the domination by BTC.
We can observe the fading of the red histograms over the MACD indicator, but still the sellers signal line is moving above the buyers line and if the bulls are consistent we can soon witness a positive crossover. In support the relative strength index has started moving towards the upper region. The RSI value is above 50 currently and to speed up the process the token needs to attract some more buyers.
ALSO READ – Blockchain.com Laid Off 25% of Its Staff
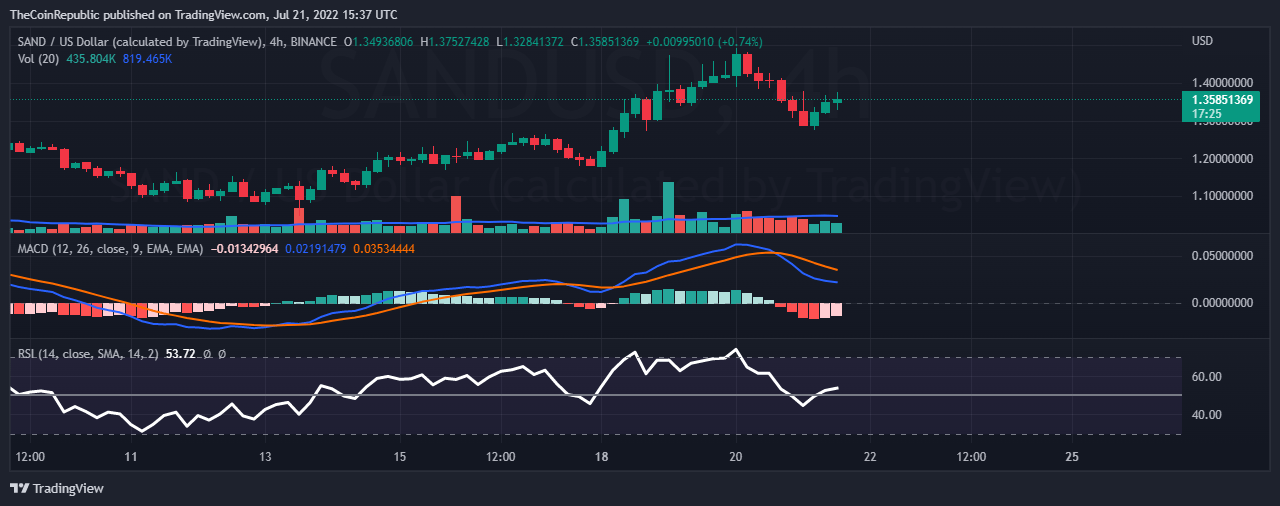
Source: SAND/USD by tradingview
Conclusion
Where the whole market is sinking amid the BTC domination, here the SAND price has started recovering over the daily and hourly price chart. The recovery is very small but it is a sign of relief for the investors. The technical indicators indicate a bullish run ahead over the hourly time frame. Hence a sign of relief for the investors and this can be a good time to make a swing entry to the market.
Technical levels
Resistance levels: $1.50 and $1.93
Support levels: $1.17 and $1.05
Disclaimer
The views and opinions stated by the author, or any people named in this article, are for informational ideas only, and they do not establish the financial, investment, or other advice. Investing in or trading crypto assets comes with a risk of financial loss.


 Bitcoin
  Ethereum
  Tether
  USDC
USDC  Dogecoin
  Cardano
  Bitcoin Cash
  Polygon
  Litecoin
  LEO Token
  OKB
OKB  Stellar
  Cosmos Hub
  Hedera
  Maker
Maker  Algorand
  NEO
NEO  Synthetix Network
  Gate
Gate  KuCoin
  IOTA
IOTA  Tether Gold
  TrueUSD
  Enjin Coin
  0x Protocol
  Ravencoin
  Holo
Holo  Siacoin
  Basic Attention
  Ontology
  Decred
  Zcash
Zcash  Lisk
Lisk  Waves
Waves  DigiByte
  Numeraire
  Status
  Nano
Nano  Pax Dollar
  Steem
Steem  OMG Network
  BUSD
BUSD  Ren
Ren  Bitcoin Diamond
  Bytom
Bytom  HUSD
HUSD  Energi
  Augur
Augur