


Shiba Inu (SHIB) Retraces After 40% Daily Increase

Shiba Inu (SHIB) has made four attempts at breaking out from a descending resistance line. While all of them have been unsuccessful, the price is gearing up for yet another one.
SHIB has been decreasing underneath a descending resistance line since Dec 24. This movement led to a low of $0.00000714 on June 18. So far, the price has made four unsuccessful breakout attempts, the most recent on Aug 14 (red arrow).
This also coincided with a rejection from the $0.00001780 horizontal resistance area. So far, the resistance line has been in place for 233 days.
During the short-term upward movement, the daily RSI has moved above 50. This is considered a sign of bullish trends. While the indicator is currently oversold, it has not yet generated any sort of bearish divergence, allowing for the possibility that the price will break out.
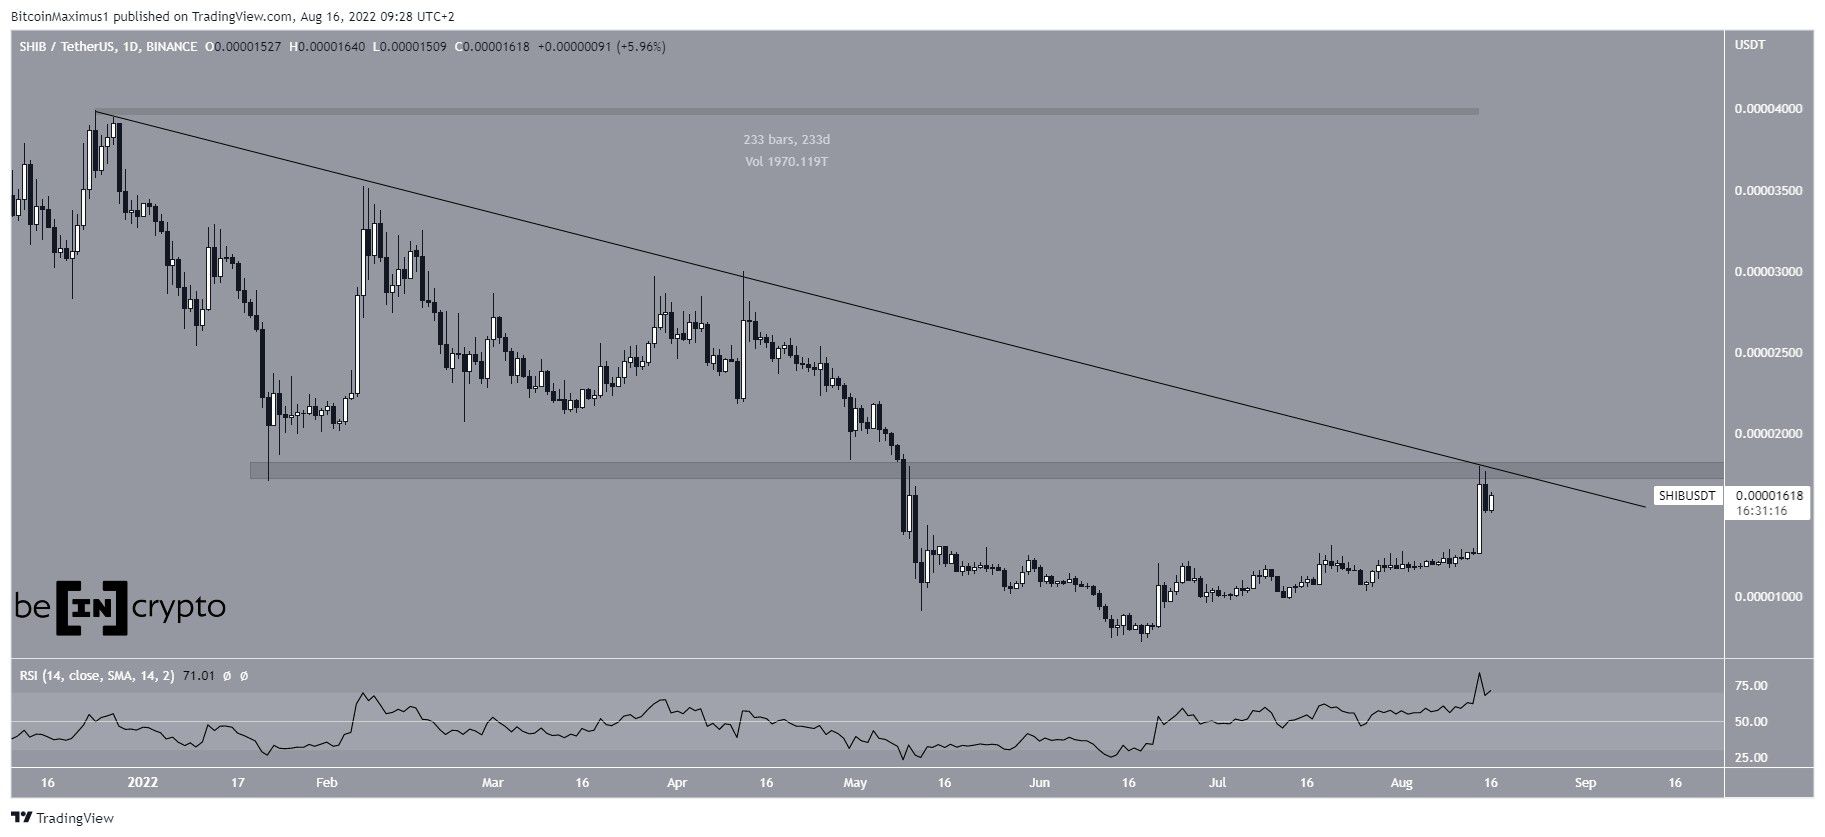
SHIB/USDT Chart By TradingView
Short-term movement
The six-hour chart does not show a clear pattern. While it is possible that the price is following an ascending support line, the line has only been validated twice.
There seems to have been a resistance area at $0.0000128, which is likely to provide support if a retracement occurs.
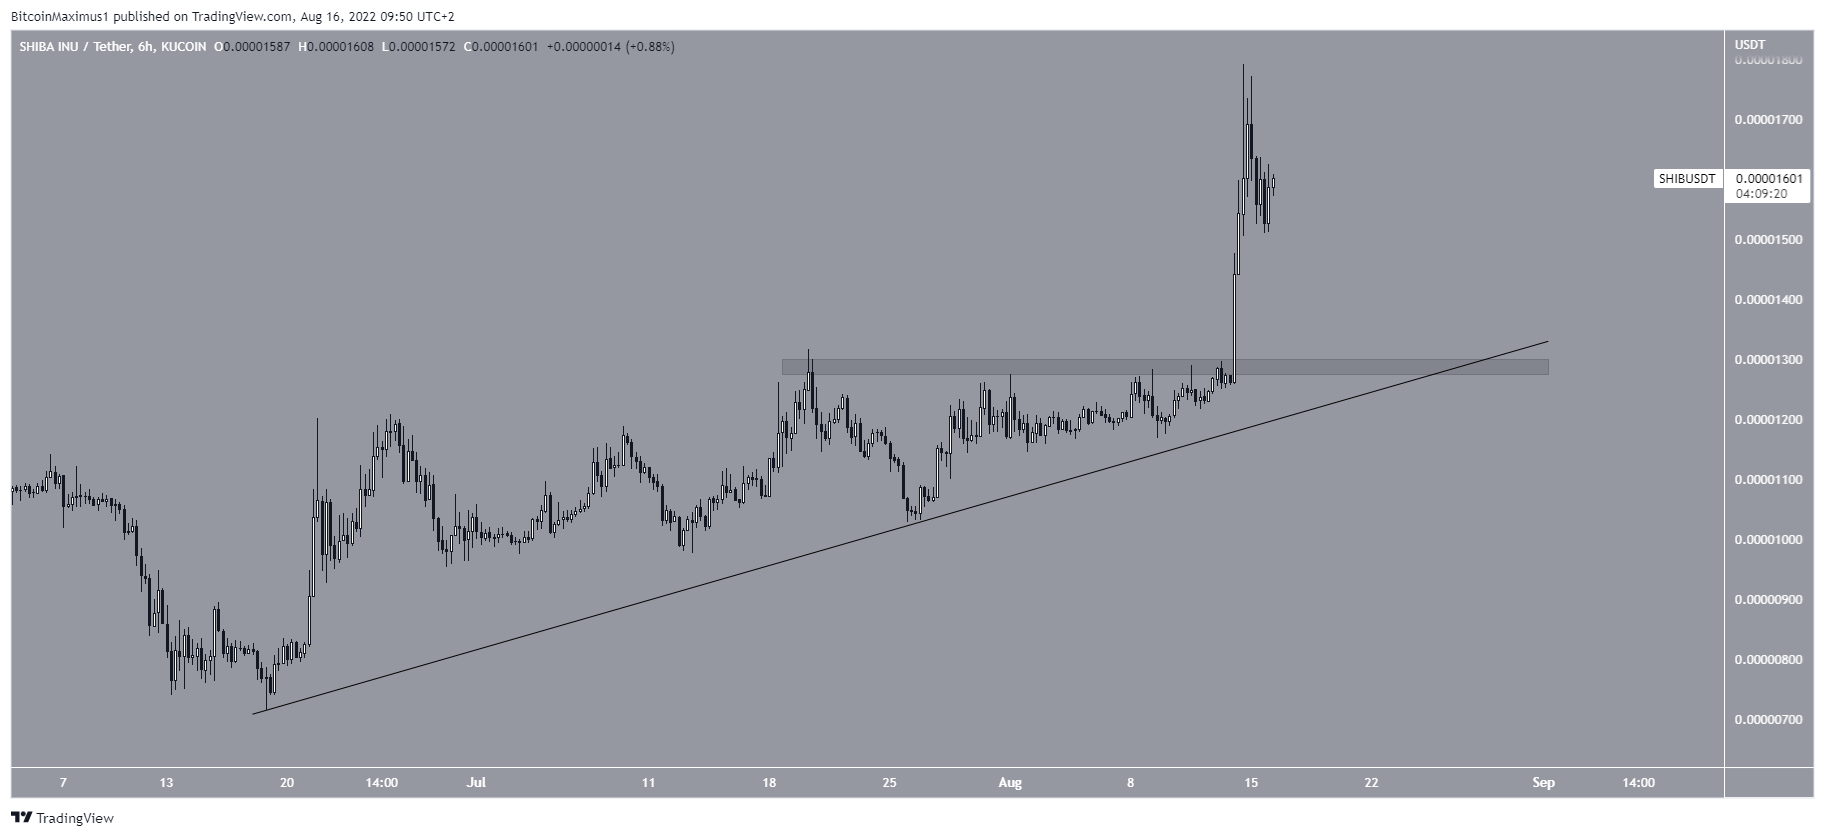
SHIB/USDT Chart By TradingView
SHIB wave count analysis
Cryptocurrency trader @Altstreetbet tweeted a chart of SHIB, stating that the price is in the process of completing wave four.
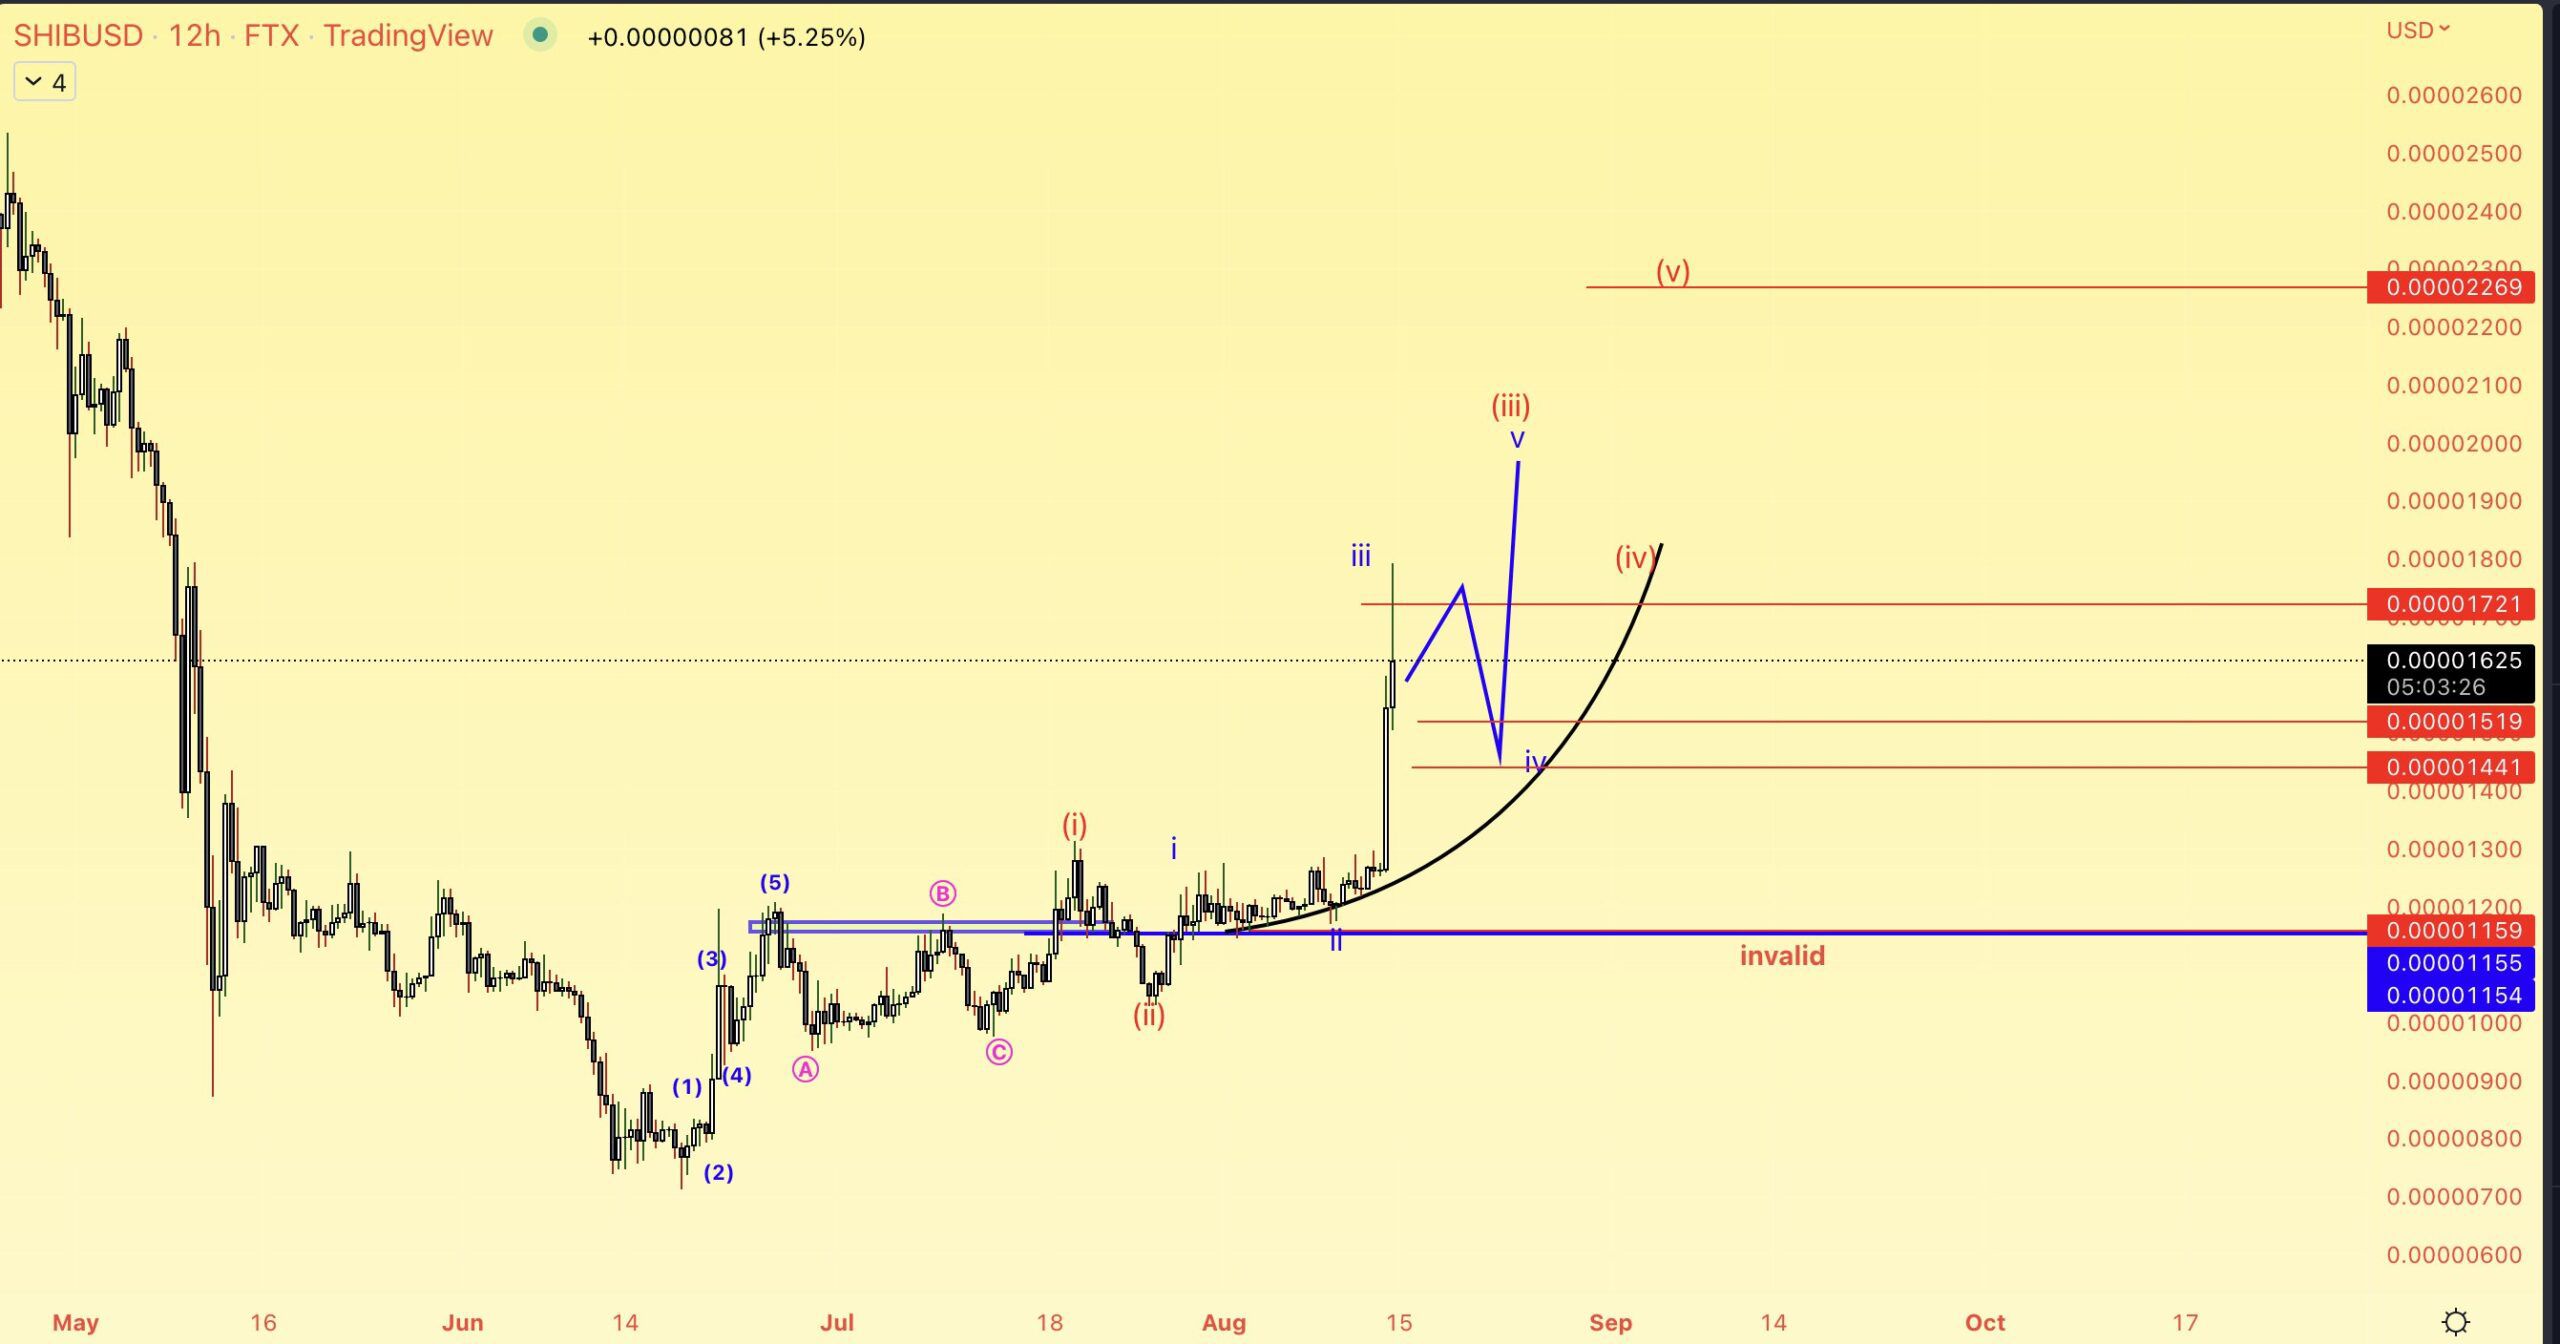
Source: Twitter
The most likely wave count does indicate that SHIB is in wave three of a five-wave upward movement. The sub-wave count is given in yellow.
If the count is correct, it would suggest that the price will break out from the aforementioned resistance line during wave three. Afterward, it will validate it as support during wave four prior to resuming its upward movement.
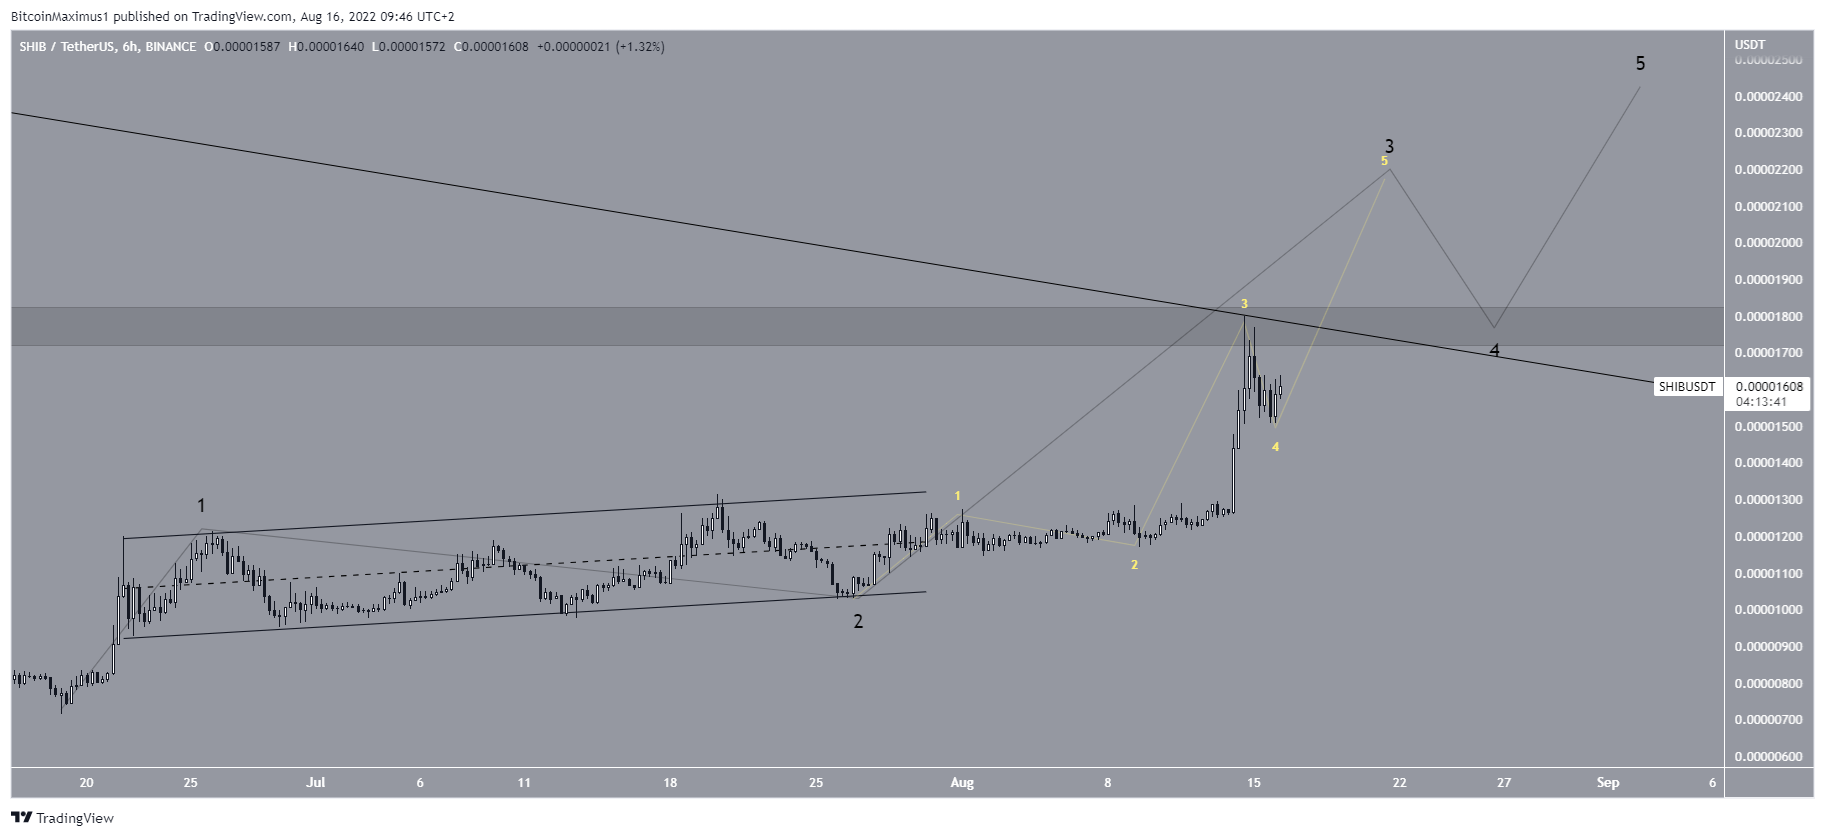
SHIB/USDT Chart By TradingView
For Be[in]Crypto’s latest Bitcoin (BTC) analysis, click here


 Bitcoin
  Ethereum
  Tether
  USDC
USDC  Dogecoin
  Cardano
  Bitcoin Cash
  Polygon
  Litecoin
  LEO Token
  Hedera
  Stellar
  Cosmos Hub
  OKB
OKB  Maker
Maker  Algorand
  NEO
NEO  Gate
Gate  Synthetix Network
  KuCoin
  IOTA
IOTA  Tether Gold
  TrueUSD
  Enjin Coin
  Ravencoin
  Holo
Holo  0x Protocol
  Siacoin
  Basic Attention
  Decred
  Ontology
  Zcash
Zcash  Lisk
Lisk  Waves
Waves  DigiByte
  Numeraire
  Status
  Nano
Nano  Steem
Steem  Pax Dollar
  OMG Network
  BUSD
BUSD  Ren
Ren  Bytom
Bytom  Bitcoin Diamond
  HUSD
HUSD  Energi
  Augur
Augur