


SingularityNET (AGIX) Price on Brink of New All-Time High After 876% Increase

The SingularityNET (AGIX) price is in the fifth and final wave of a massive increase. It is not yet certain if the wave will continue extending or if a top is close.
The AGIX price has been on a tear since the beginning of the year, increasing by 876%. The upward movement led to a high of $0.48 in Feb. 2023.
More importantly, the price reclaimed the $0.42 resistance area, which is also the 0.618 Fib retracement resistance level. If it validates it as support, the price could increase toward its all-time high of $0.67.
On the other hand, a weekly close below the $0.42 area would mean that the breakout was illegitimate. In that case, the price could fall to the closest long-term support at $0.22.
The weekly RSI is increasing and has not generated any bearish divergence yet, despite being overbought. Therefore, the increase may continue toward the all-time high.
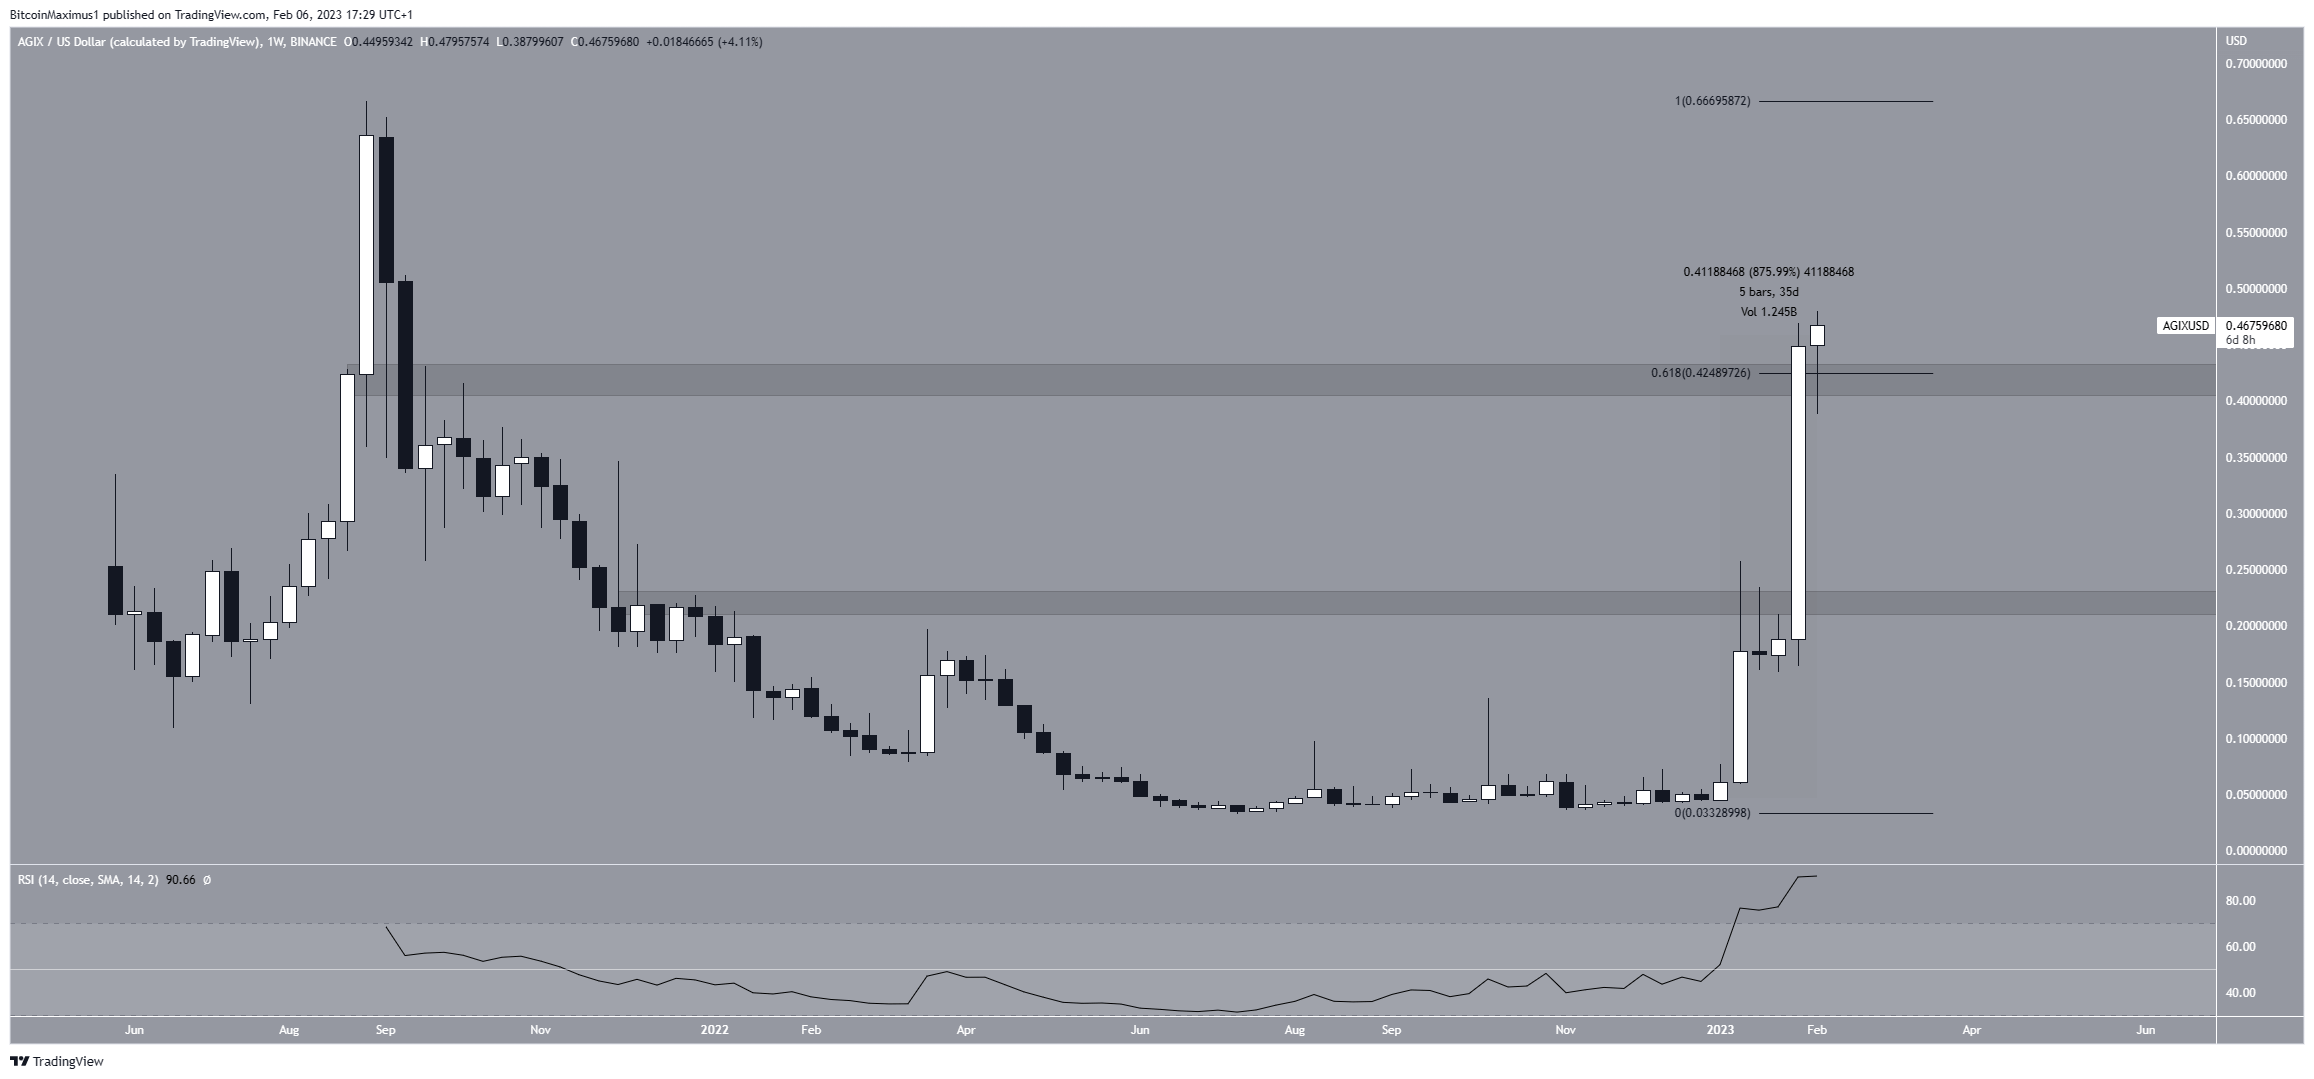
AGIX/USD Weekly Chart. Source: TradingView
AGIX Price Forecast: Retracement or All-Time High?
The technical analysis from the daily chart gives conflicting signs. The AGIX price is likely in the fifth and final wave of an increase. The closest Fib target for the move is at $0.52, created by the 1.61 length of waves one and three combined. However, the increase seems to have lost a little steam over the past 24 hours.
If the price gets there, whether the daily RSI generates bearish divergence or not can determine the future trend’s direction.
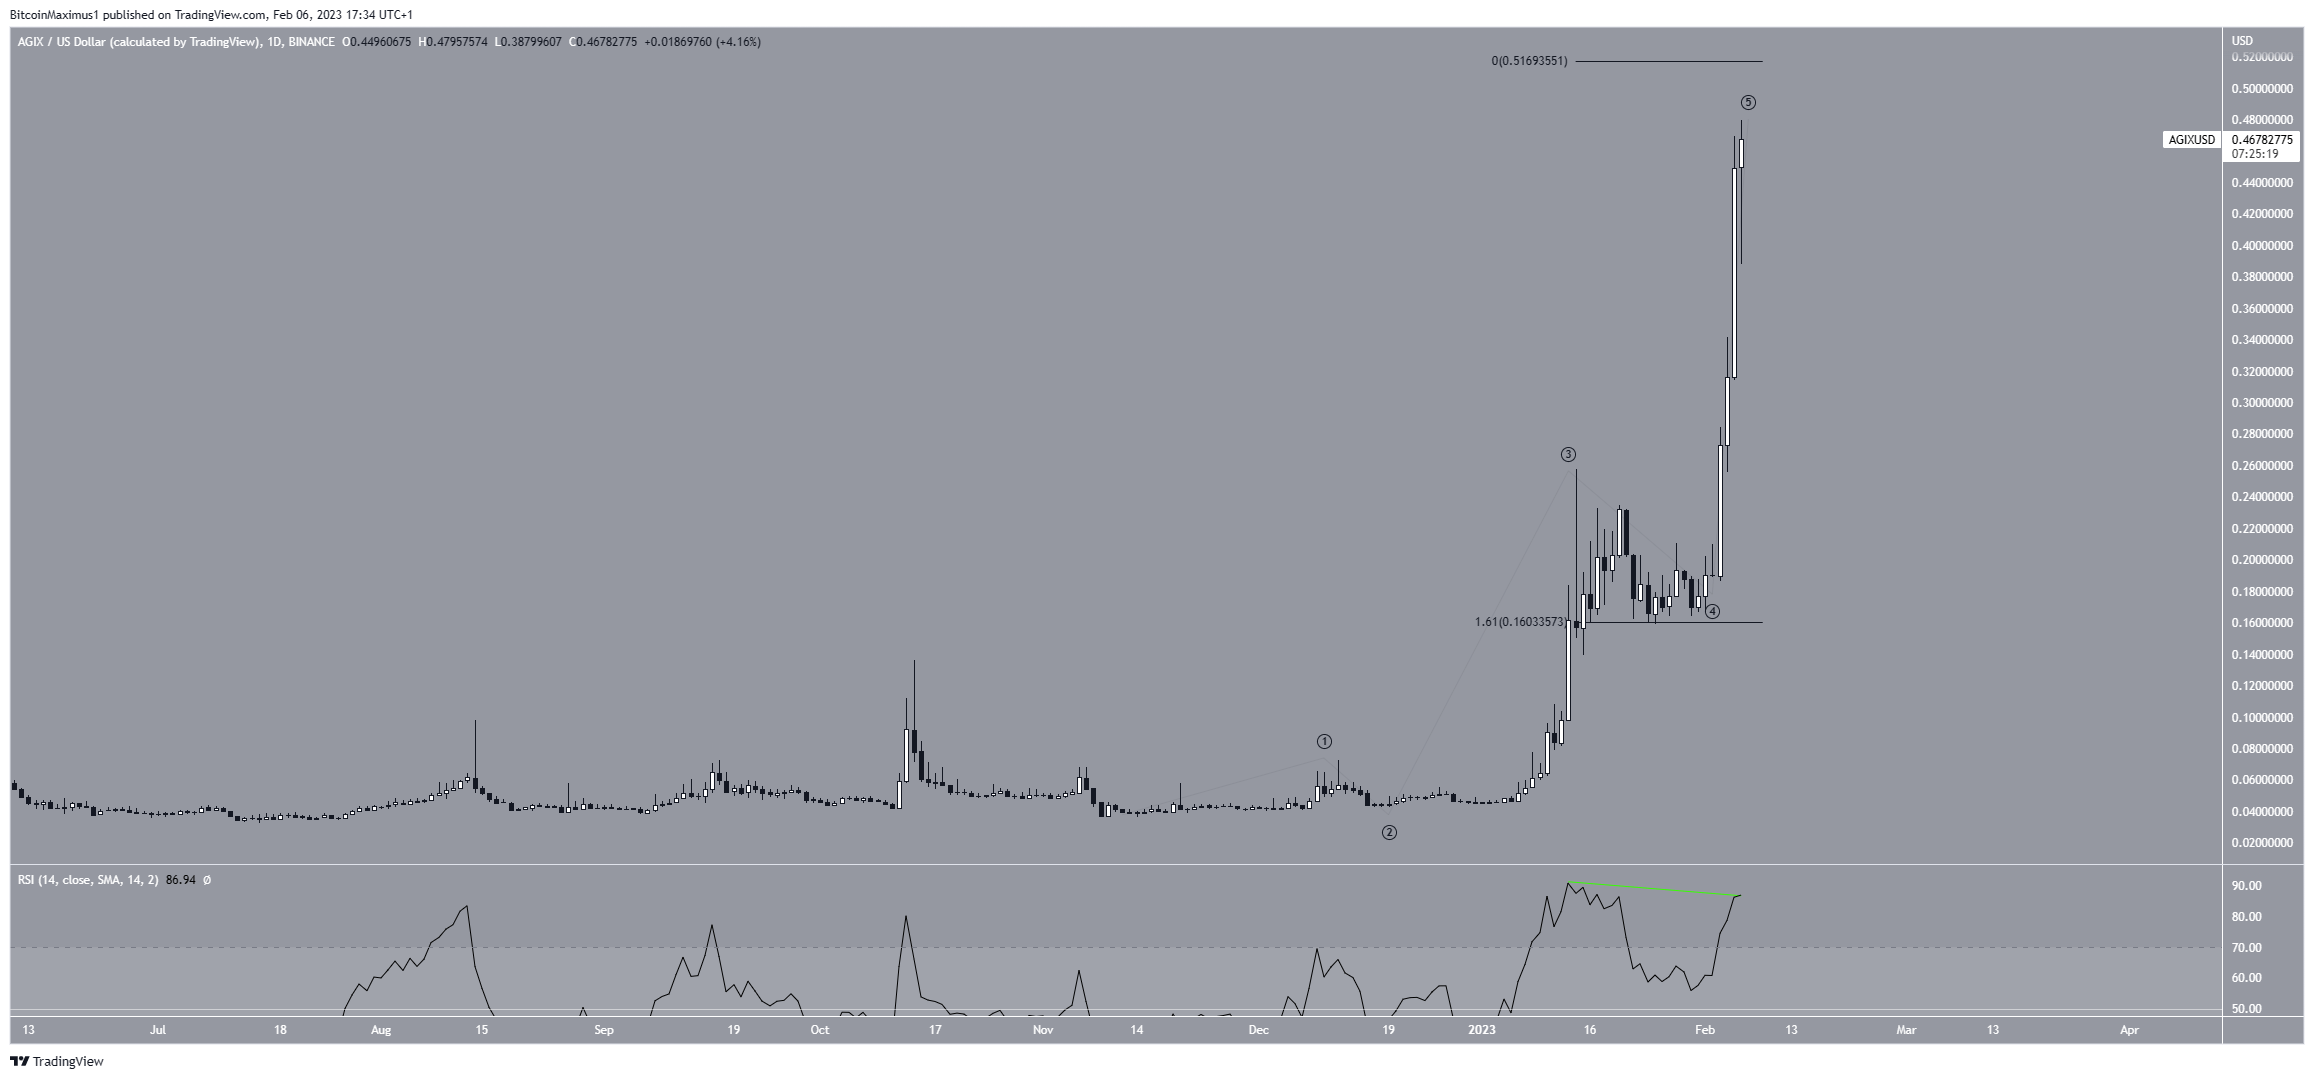
AGIX/USD Six-Hour Chart. Source: TradingView
To conclude, the future AGIX price trend is unclear. While a high of $0.52 is expected, whether the RSI generates bearish divergence once it gets there could determine the direction of the next move. A bearish divergence could mean that the upward movement is complete, while a lack of divergence could lead to a new all-time high.


 Bitcoin
  Ethereum
  Tether
  USDC
USDC  Dogecoin
  Cardano
  Bitcoin Cash
  Polygon
  Litecoin
  LEO Token
  OKB
OKB  Stellar
  Cosmos Hub
  Hedera
  Maker
Maker  Algorand
  NEO
NEO  Synthetix Network
  Gate
Gate  KuCoin
  IOTA
IOTA  Tether Gold
  TrueUSD
  Enjin Coin
  0x Protocol
  Ravencoin
  Holo
Holo  Siacoin
  Basic Attention
  Ontology
  Zcash
Zcash  Decred
  Lisk
Lisk  Waves
Waves  DigiByte
  Numeraire
  Status
  Nano
Nano  Pax Dollar
  Steem
Steem  OMG Network
  BUSD
BUSD  Ren
Ren  Bitcoin Diamond
  Bytom
Bytom  HUSD
HUSD  Energi
  Augur
Augur