


SOL Bulls Flee as Price Drops Over 5% Owing to Bearish Pressures
The Solana (SOL) market has been steadily declining in the last 24 hours after encountering resistance at the intra-day high of $24.43. As a result of the bear grip, the SOL price fell to a low of $23.02 before finding support in the market. As of press time, the SOL price had dropped by 5.14% to $23.11, demonstrating the downturn.
During the downturn, market capitalization fell by 4.91% to $8,628,145,691, and 24-hour trading volume increased by 73.32% to $591,465,013. Despite a spike in 24-hour trading volume during the bear grip, SOL’s market performance indicates that investors are becoming increasingly wary of its current high valuation.
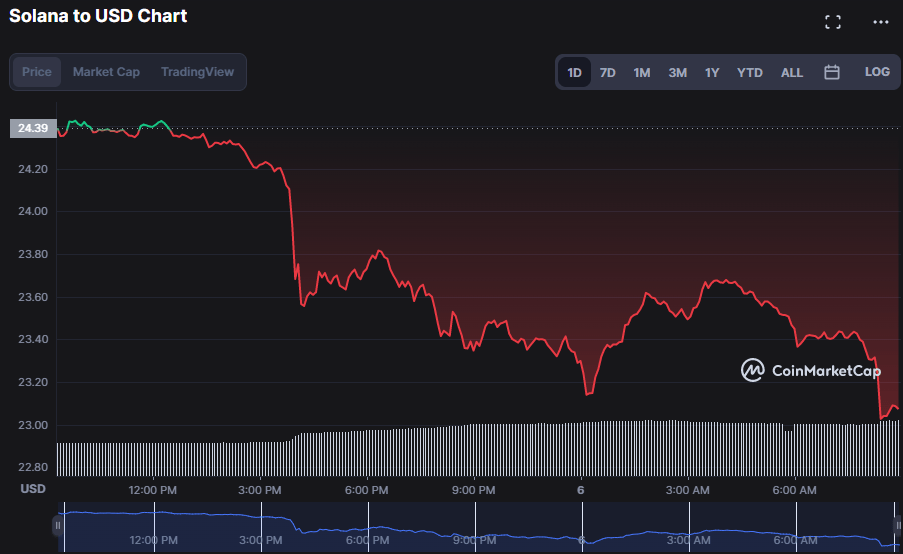
SOL/USD 24-hour price chart (source: CoinMarketCap)
The Bollinger Bands are pointing south, with the upper and lower bands at 24.99 and 22.84. This metric indicates that bearish sentiment is prevalent in the market and might remain so in the short term. These expectations are reinforced by the market’s decreasing volatility, as indicated by the distance between the upper and lower bands, which is currently at 2.15. This suggests that investors are becoming more risk-averse, implying that further price declines are likely in the short term.
With a stochastic RSI reading of 11.59 and moving below its signal line, the current bearish trend has more momentum and is likely to continue in the short term. This move indicates that investors are becoming more conservative in their investment strategies, preferring to keep money on the sidelines until market conditions improve. In addition, the market’s volatility is decreasing, and the stochastic RSI is reading below its signal line, indicating that investors are becoming more risk-averse.
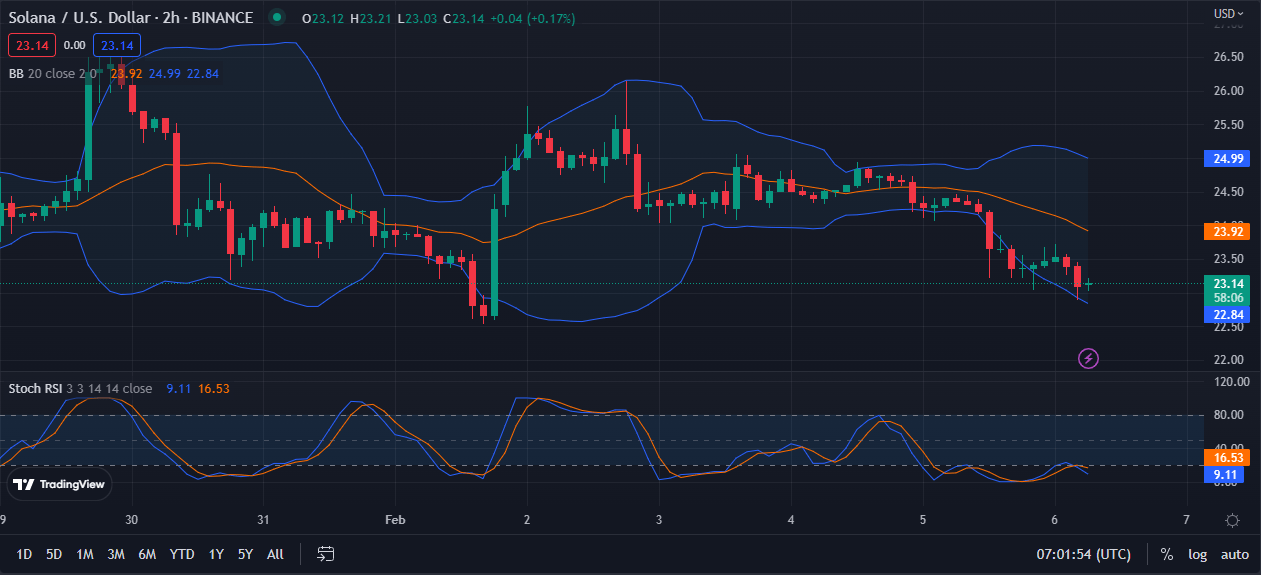
SOL/USD 2-hour price chart (source: TradingView)
With a reading of -0.34, the MACD line shifts below its signal line into the negative region, emphasizing the negative sentiment in the SOL market. Traders following this trend will likely take a bearish position, expecting SOL’s price to fall. This sentiment is supported by the histogram, which shows a decrease in the divergence between the MACD and signal lines, indicating that the negative momentum is gaining ground and thus anticipation for a ber run.
The Average True Range (ATR) reading of 0.35 also supports the bearish sentiment in the SOL market, as it is less than 0.50, which indicates a decrease in market volatility, and traders tend to take bearish positions when volatility is low. This ATR reading confirms that market sentiment is currently bearish, and traders should brace themselves for a possible price decrease in SOL.
The Aroon up is 14.29%, while the Aroon down is 92.86%. As the Aroon down reading is much higher than the Aroon up reading, this indicates that the current trend is bearish and is strengthening. This move reflects the market’s overwhelming selling pressure and suggests that traders brace themselves for further price declines in SOL.
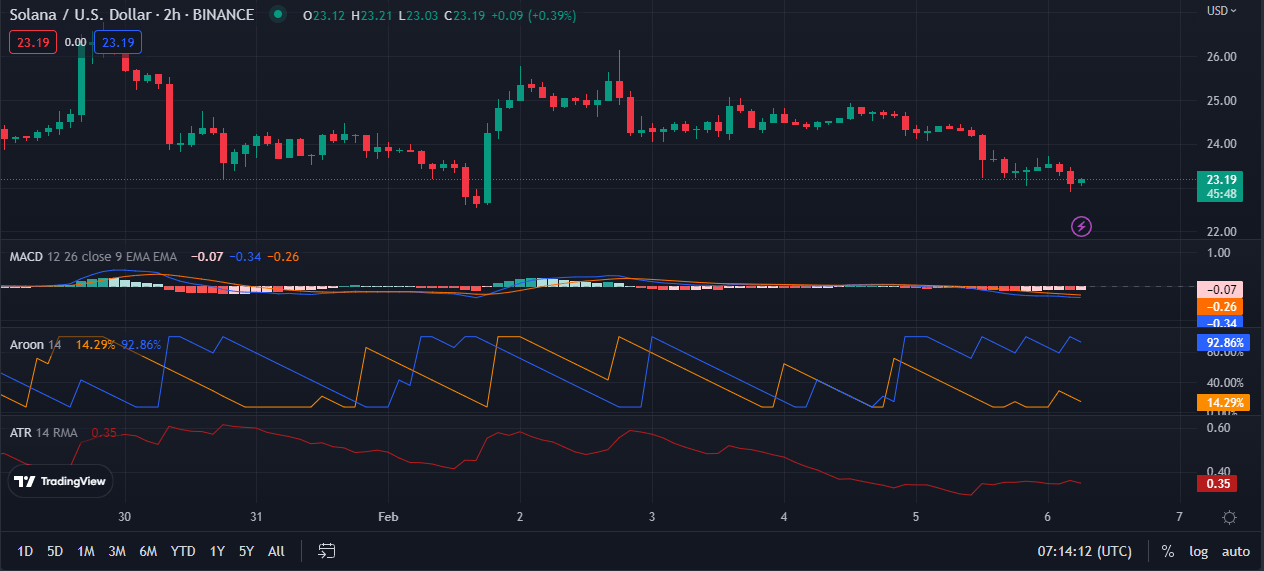
SOL/USD 2-hour price chart (source: TradingView)
To reverse the bearish trend in the SOL market, bulls need to keep pushing prices higher and maintaining resistance levels.
Disclaimer: The views and opinions, as well as all the information shared in this price analysis, are published in good faith. Readers must do their own research and due diligence. Any action taken by the reader is strictly at their own risk. Coin Edition and its affiliates will not be held liable for any direct or indirect damage or loss.


 Bitcoin
  Ethereum
  Tether
  USDC
USDC  Dogecoin
  Cardano
  Bitcoin Cash
  Polygon
  Litecoin
  LEO Token
  OKB
OKB  Stellar
  Cosmos Hub
  Hedera
  Maker
Maker  Algorand
  NEO
NEO  Synthetix Network
  Gate
Gate  KuCoin
  IOTA
IOTA  Tether Gold
  TrueUSD
  Enjin Coin
  0x Protocol
  Ravencoin
  Holo
Holo  Siacoin
  Basic Attention
  Decred
  Zcash
Zcash  Ontology
  Waves
Waves  Lisk
Lisk  DigiByte
  Numeraire
  Status
  Nano
Nano  Pax Dollar
  Steem
Steem  OMG Network
  BUSD
BUSD  Ren
Ren  Bitcoin Diamond
  Bytom
Bytom  HUSD
HUSD  Energi
  Augur
Augur