


SOL presents day trading opportunities amid a questionable downtrend

- Solana price has lost 22% of its market value since mid-September.
- The Volume Profile indicator is still questionable as to who dominates the market.
- Invalidation of the bullish idea is contingent upon a few factors mentioned below.
Solana price could show a bounce soon. Key levels have been identified.
Solana price is a trader’s chart
Solana price has day traders watching the bulls closely, attempting to reclaim grounds with the 8-day exponential moving average. The bullish retaliation comes after Solana’s recent 22% decline since mid-September. On larger time frames, the Solana price is stair-stepping into support on the Relative Strength Index. Thus, this is a crucial time for the centralized smart contract token and keeping a close eye is justified.
Solana price currently auctions at $32. The downrtrend’s power is still up for debate as the Volume Profile Indicator shows a sparse reading. If the bulls can hurdle the 21-day simple moving average at $33.14, then a more confident countertrend trade idea will present itself.
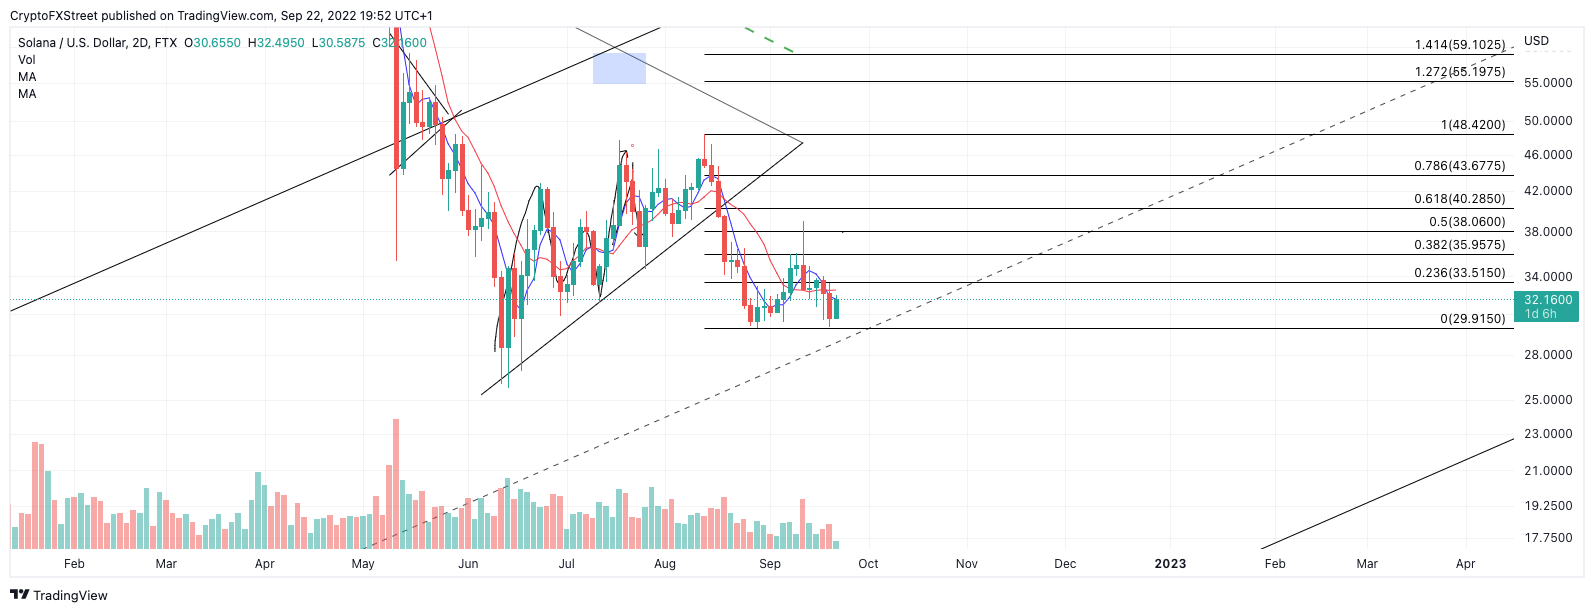
SOL USDT 2-Day Chart
A daily close above $33.14 should give sidelined bulls permission to the 38.2% Fibonacci retracement level (based on the previous swing high to swing low) marked at $35.95.=
Invalidation of the bullish idea is contingent upon the June 14 swing low at $25.75 holding up. If the bears were to breach this level, a further decline targeting a previous congestion zone near $20 could result in a 27% decrease from the current Solana price.
In the following video, our analysts deep dive into the price action of Solana, analyzing key levels of interest in the market.


 Bitcoin
  Ethereum
  Tether
  USDC
USDC  Dogecoin
  Cardano
  Bitcoin Cash
  Polygon
  Litecoin
  LEO Token
  OKB
OKB  Cosmos Hub
  Stellar
  Hedera
  Maker
Maker  Algorand
  NEO
NEO  Synthetix Network
  Gate
Gate  KuCoin
  IOTA
IOTA  Tether Gold
  TrueUSD
  Enjin Coin
  0x Protocol
  Ravencoin
  Holo
Holo  Siacoin
  Basic Attention
  Decred
  Zcash
Zcash  Ontology
  Waves
Waves  Lisk
Lisk  DigiByte
  Numeraire
  Status
  Nano
Nano  Pax Dollar
  Steem
Steem  OMG Network
  BUSD
BUSD  Ren
Ren  Bitcoin Diamond
  Bytom
Bytom  HUSD
HUSD  Energi
  Augur
Augur