


Solana price analysis: SOL bullish rally crashes around $46 resistance level

Solana price analysis is showing bearish signs once again, as the token crashed over 7 percent this morning. This came about after price touched a month-long high at $47.22 after a propelling upward trend that initiated on July 13, 2022. Since then, SOL price rose over 46 percent and looked to be heading up to the $50 mark. A breakout above the $46 level could have initiated a test of $50 resistance, but Solana seemingly faced a rejection around the current price at $47. If the downtrend extends, SOL could move down to $42 which could signal the end of the bullish run.
The larger cryptocurrency market showed mixed signals across the board over the past 24 hours, as Bitcoin consolidated past the $23,500 mark. Ethereum faced a minor correction around $1,500, whereas leading Altcoins also depicted minor downtrends. Cardano consolidated at $0.51, while Ripple moved down to $0.36 with a small decline. Dogecoin rose 2 percent to reach $0.07, whereas Polkadot dropped more than 3 percent to move down to $7.71.
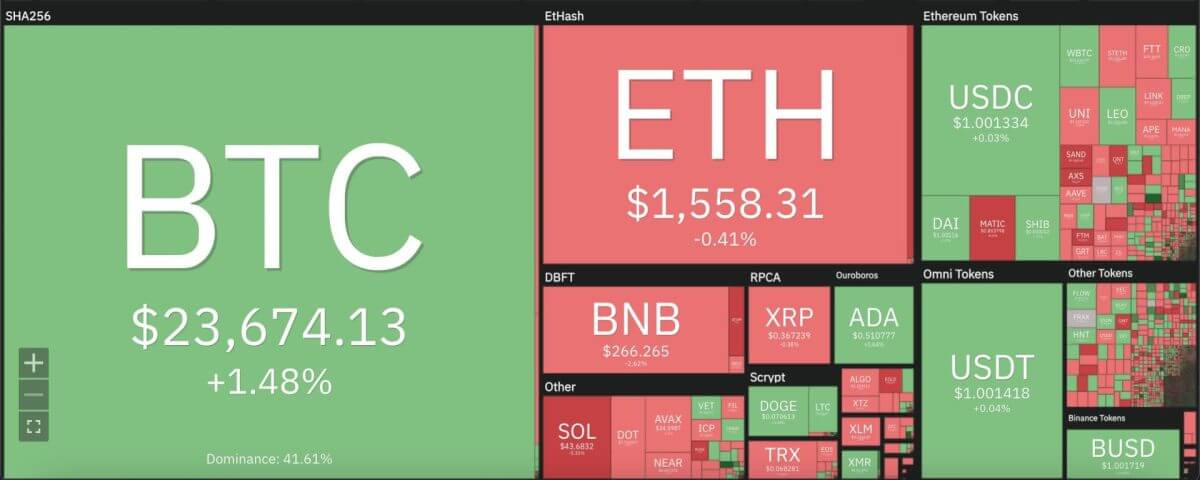
Solana price analysis: Cryptocurrency heat map. Source: Coin360
Solana price analysis: Overbought RSI undergoes significant dip on daily chart
On the 24-hour candlestick chart for Solana price analysis, price can be seen forming an Evening Star pattern which indicates a sudden change in trend following an extend bullish run for SOL. After touching a month-long high at $47.11, price can now be seen falling as low as $41.11 and permanent settlement below support at $42 could signal the end of the bullish rally. SOL price still sits comfortably clear of the 9 and 21-day moving averages, along with the crucial 50-day exponential moving average (EMA) at $40.34 on the 24-hour chart.
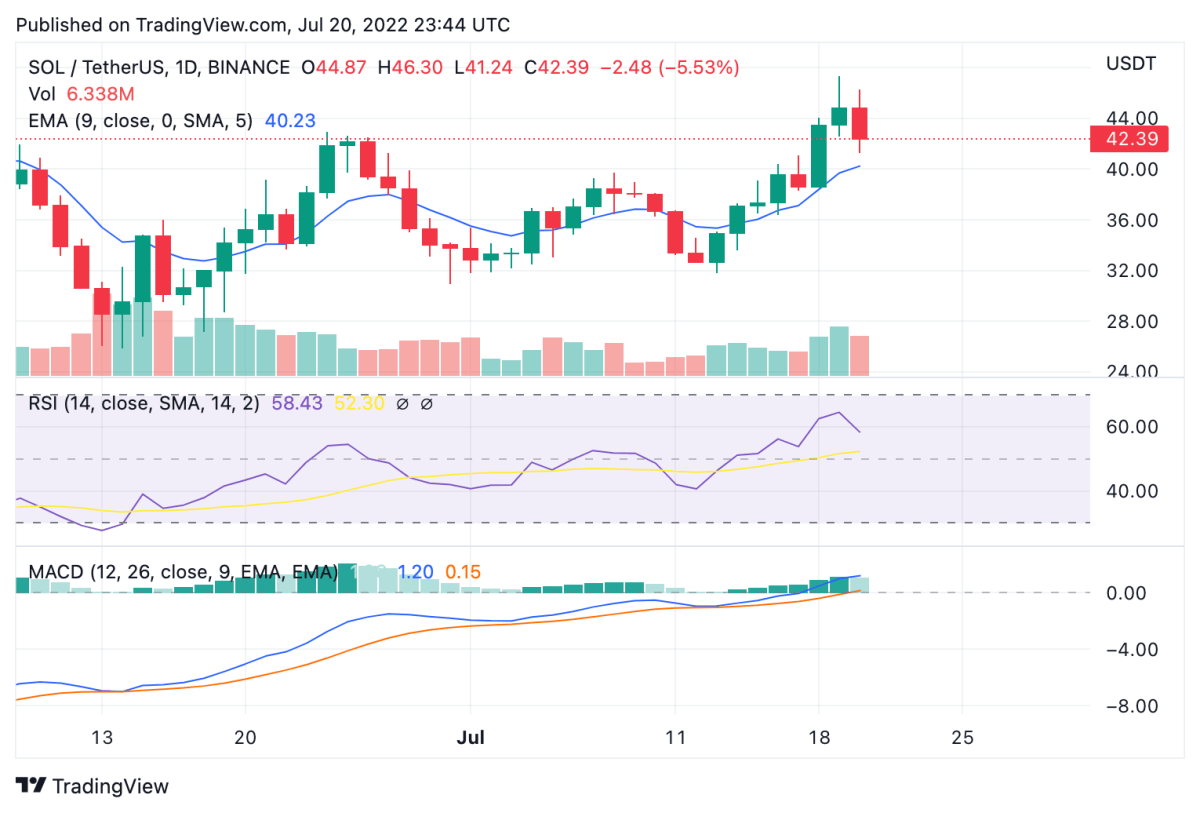
Solana price analysis: 24-hour chart. Source: Trading View
However, the 24-hour relative strength index (RSI) shows worrying signs after depleting down to 58.32 in a matter of hours, shortly after touching overbought market valuation at 63.94. The RSI trend goes in line with the current price correction in place while a 27 percent dip in trading volume suggests that traders are waiting to see the extent of the decline in place. Meanwhile, the moving average convergence divergence (MACD) curve can be seen forming lower highs currently, but sits comfortably above the neutral zone. Over the next 24 hours, the bullish thesis can be invalidated if SOL price reaches below support at $42 where the second string support at $40 will come into place.
Disclaimer. The information provided is not trading advice. Cryptopolitan.com holds no liability for any investments made based on the information provided on this page. We strongly recommend independent research and/or consultation with a qualified professional before making any investment decisions.


 Bitcoin
  Ethereum
  Tether
  USDC
USDC  Dogecoin
  Cardano
  Bitcoin Cash
  Polygon
  Litecoin
  LEO Token
  OKB
OKB  Cosmos Hub
  Stellar
  Maker
Maker  Hedera
  Algorand
  NEO
NEO  Synthetix Network
  Gate
Gate  KuCoin
  IOTA
IOTA  Tether Gold
  TrueUSD
  Enjin Coin
  0x Protocol
  Ravencoin
  Siacoin
  Holo
Holo  Basic Attention
  Decred
  Zcash
Zcash  Ontology
  Waves
Waves  DigiByte
  Lisk
Lisk  Numeraire
  Status
  Pax Dollar
  Nano
Nano  Steem
Steem  OMG Network
  BUSD
BUSD  Ren
Ren  Bitcoin Diamond
  Bytom
Bytom  HUSD
HUSD  Energi
  Augur
Augur