


Solana price analysis: SOL dip could get worse with critical support at $25

Solana price analysis is bearish today, as price continues along a downtrend that initiated on July 31, 2022, with price at month-long high at $46.69. SOL price dropped another 4 percent over the past 24 hours, moving as low as $39.88, and sitting at $40.39 at the time of writing. Solana faces danger of a significant crash down to critical support at $25, with seller pressure increasing and price moving below the crucial moving averages on the daily chart. A bullish intervention from buyers could still propel price upwards to resistances at $49 and $60.
The larger cryptocurrency market showed mixed signals from over the past 24 hours, majorly showing small declines. Bitcoin moved down to the $23,000 mark to settle there, while Ethereum rose 2 percent to move close to $1,700. Among leading Altcoins, Cardano dropped 2 percent to $0.50, while Ripple settled at $0.37. Dogecoin stayed around $0.06, whereas Polkadot dropped 3 percent to move down to $7.97.
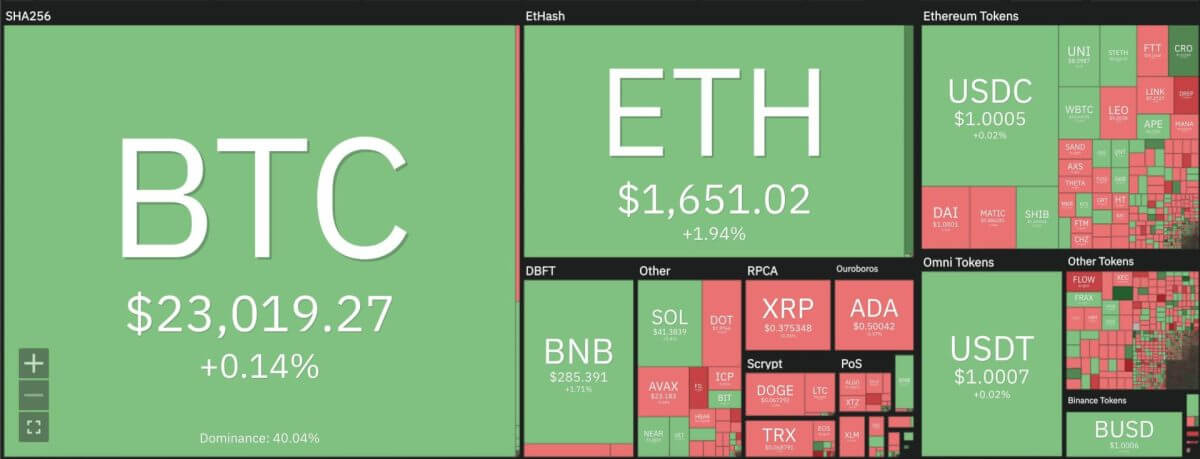
Solana price analysis: Cryptocurrency heat map. Source: Coin360
Solana price analysis: SOL market valuation suffers hit on 24-hour chart
On the 24-hour candlestick chart for Solana price analysis, price can be seen extending into a descending triangle pattern based on price action over the past 24 and 48 hours. SOL lowered down to $39.53 today, the lowest point since July 23, 2022, as price enjoyed a run up to the $46 mark just last week. Since then, market volatility has picked up with most cryptocurrencies, with Solana being one in danger to crash down to critical support at $25.
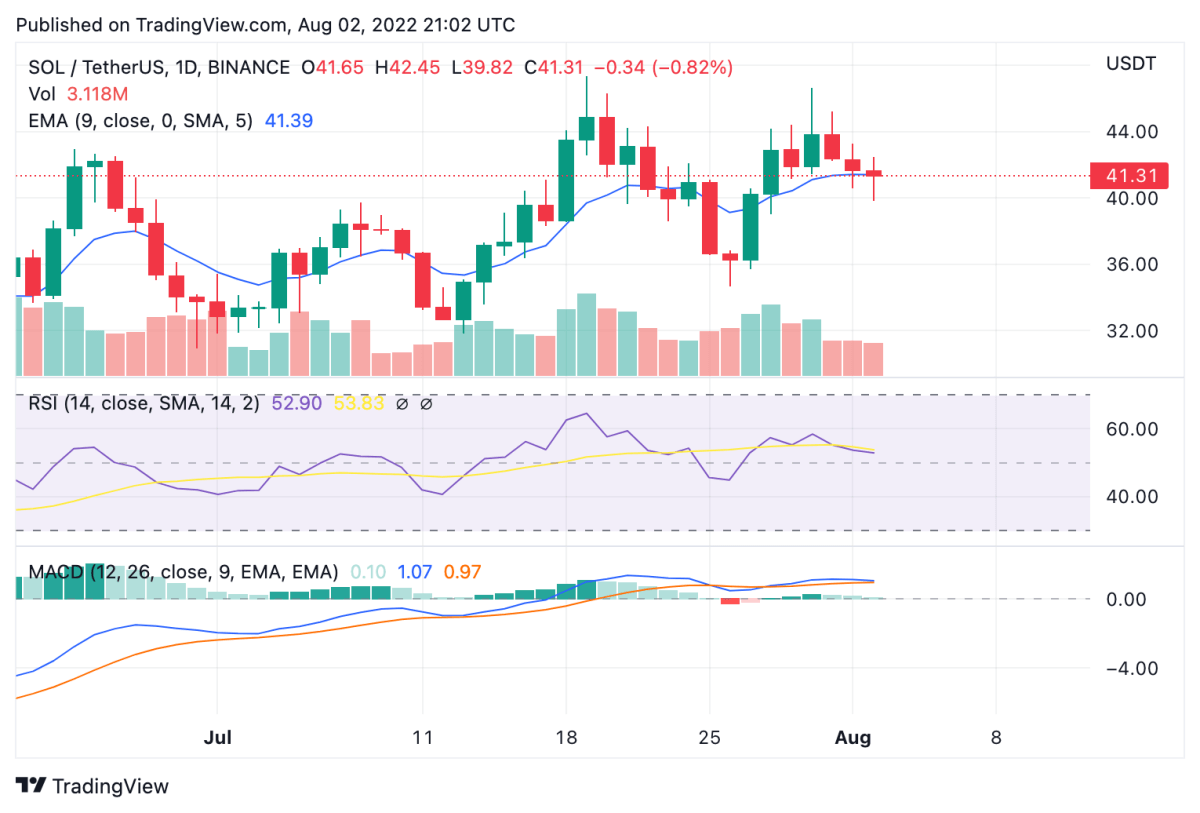
Solana price analysis: 24-hour chart. Source: Trading View
Price over the past 24 hours has lowered below the 9 and 21-day moving averages, along with the 50-day exponential moving average (EMA) at $40.86. The 50EMA had been a barrier between a severely bearish price scenario and residual bullish momentum from the previous trend and still remains crucial for Solana’s prospects to reverse the current downtrend. The 24-hour relative strength index (RSI) also shows lowering market valuation after lowering below the 50 mark. Trading volume also lowered 9 percent over the past 24 hours. Meanwhile, the moving average convergence divergence (MACD) curve has also turned bearish and can be seen forming lower lows around the neutral zone.
Disclaimer. The information provided is not trading advice. Cryptopolitan.com holds no liability for any investments made based on the information provided on this page. We strongly recommend independent research and/or consultation with a qualified professional before making any investment decisions.


 Bitcoin
  Ethereum
  Tether
  USDC
USDC  Dogecoin
  Cardano
  Bitcoin Cash
  Polygon
  Litecoin
  LEO Token
  Stellar
  OKB
OKB  Cosmos Hub
  Hedera
  Maker
Maker  Algorand
  NEO
NEO  Synthetix Network
  Gate
Gate  KuCoin
  IOTA
IOTA  Tether Gold
  TrueUSD
  Enjin Coin
  0x Protocol
  Ravencoin
  Holo
Holo  Siacoin
  Basic Attention
  Decred
  Zcash
Zcash  Ontology
  Lisk
Lisk  Waves
Waves  DigiByte
  Numeraire
  Status
  Nano
Nano  Pax Dollar
  Steem
Steem  OMG Network
  BUSD
BUSD  Ren
Ren  Bitcoin Diamond
  Bytom
Bytom  HUSD
HUSD  Energi
  Augur
Augur