


Solana price analysis: SOL up tracks to $32.5 as bulls aim for 33.3

The Solana price analysis shows bullish price movement for today as bulls are trying to continue their lead and have succeeded so far in their efforts as the price has increased today. The past week had been favorable for the bears as the price underwent loss at a considerable rate. From 14 August to 28 August 2022, the price fell from 46.5 to $30.3, which shows the intensity of the bearish trend, but today, the trend is in favor of the bulls, as they are at the leading position. It is anticipated that the price will move higher than $32.5 in the coming hours as well.
SOL/USD 1-day price chart: 7.45 percent increase observed in coin’s value
The one-day Solana price analysis is predicting an increase in DOT/USD crypto pair’s value as the bulls are now trying to occupy the front position. The successive downtrend has been reversed as now the bulls have been leading the price charts since yesterday. The price underwent a considerable recovery and increased from $30.3 to $32.5 since yesterday, gaining 7.45 percent value during the last 24 hours. The price level is still below the moving average (MA) value which is standing at $33.3 at present.
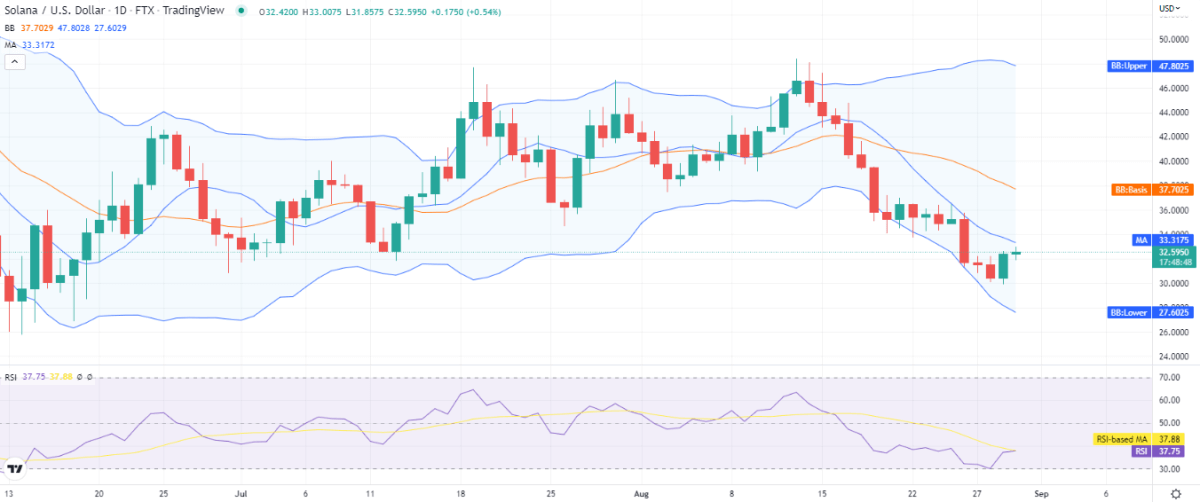
SOL/USD 1-day price chart. Source: TradingView
The Bollinger bands have been diverging sharply, indicating the volatility to increase in the coming days. Their average value is settled at $37.7, while their upper value is at $47.8, and the lower value is at $27.6, representing the strongest resistance and support levels for the cryptocurrency, and the scale of volatility prevalence is quite clear. The Relative Strength Index (RSI) score is quite neutral as the indicator is trading at index 37 for the day, the RSI curve is showing horizontal movement hinting at a lack of momentum, but the curve may move upwards if buying momentum intensifies.
Solana price analysis: Recent developments and further technical indications
The 4-hour Solana price analysis is in favor of bulls despite the price breaking downwards at the start of the trading session, as bears tried to intervene, but bullish support appeared again, and the price is seen spiraling up for the last four hours. A green candlestick marks the return of the bullish trend, and a further increase in price is expected. The price has been taken up to $32.6 as a consequence of the increasing bullish efforts. The recent uptrend has taken the price quite higher than the moving average value, i.e., $31.4 on the 4-hour chart.
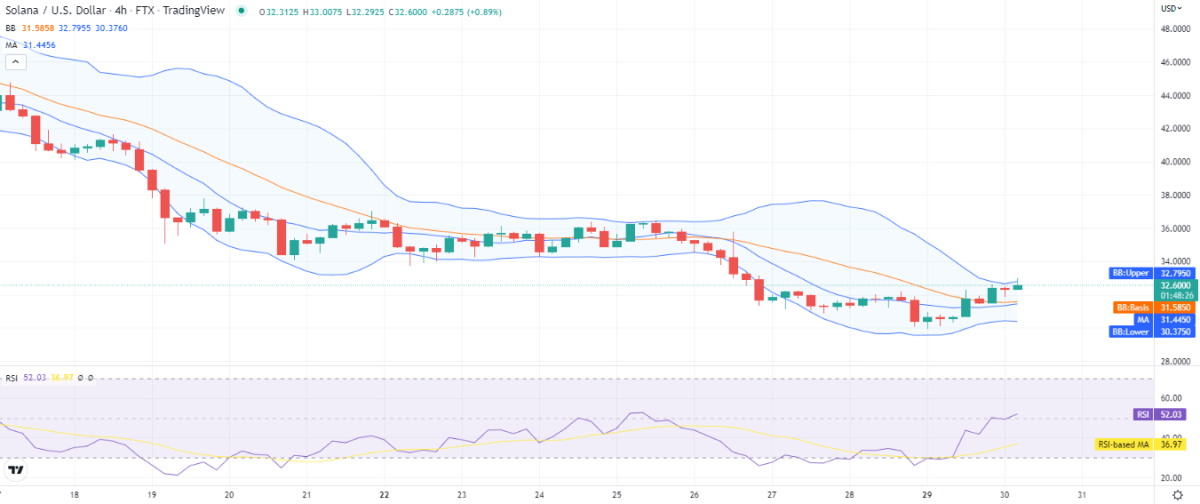
SOL/USD 4-hours price chart. Source: TradingView
The volatility has started to increase in the last four hours, which may provide an opportunity for bulls to continue their endeavor. On the other hand, the upper and lower Bollinger bands values have been readjusted to $32.7 and $30.3 as well. The RSI score has started to revive because of the buying trend and has moved up to index 52.
Solana price analysis: Conclusion
The Solana price analysis indicates the price is headed upwards once again after the bulls returned on the candlestick chart today. The DOT/USD price has recovered to the $32.6 level and is expected to move up even further. The hourly price chart is predicting the same as the price covered movement upwards during the last four hours as well. The recovery might continue for today if the support persists at $31.8.
Disclaimer. The information provided is not trading advice. Cryptopolitan.com holds no liability for any investments made based on the information provided on this page. We strongly recommend independent research and/or consultation with a qualified professional before making any investment decisions.


 Bitcoin
  Ethereum
  Tether
  USDC
USDC  Dogecoin
  Cardano
  Bitcoin Cash
  Polygon
  Litecoin
  LEO Token
  Hedera
  Stellar
  Cosmos Hub
  OKB
OKB  Maker
Maker  Algorand
  NEO
NEO  Gate
Gate  KuCoin
  Synthetix Network
  IOTA
IOTA  Tether Gold
  TrueUSD
  Enjin Coin
  Ravencoin
  Holo
Holo  0x Protocol
  Siacoin
  Basic Attention
  Ontology
  Decred
  Zcash
Zcash  Waves
Waves  Lisk
Lisk  DigiByte
  Numeraire
  Status
  Nano
Nano  Pax Dollar
  Steem
Steem  OMG Network
  BUSD
BUSD  Ren
Ren  Bytom
Bytom  Bitcoin Diamond
  HUSD
HUSD  Energi
  Augur
Augur